
ENERGY STAR recently issued a press release stating that “Nearly 40 percent of the nation’s building space is benchmarked in Portfolio Manager, driving billions of dollars of energy savings while helping reduce greenhouse gases in the fight against climate change.” Follow up questions to the EPA yielded additional information that Portfolio Manager has data representing about 300,000 unique commercial buildings containing 30 billion gsf of space.
Now according to the latest Commercial Building Energy Consumption Survey (CBECS) conducted in 2003 the nation has about 4.6 million buildings containing 70 billion gsf of space. Ignoring any increase in the nation’s building stock since 2003, that would mean that the 40% of the nation’s gsf contained in Portfolio Manager belongs to only 5% of its buildings.
Below is a graph showing the distribution of U.S. Commercial building numbers (red) and gsf (blue) versus building size (in sf) as determined from 2003 CBECS data. The graph shows that approximately half the total gsf is contained in just the largest 5% of buildings (> 50,000 sf). You can also see that 40% of the gsf is contained in the largest 4% of the buildings. Portfolio Manager has data from 6% of the nation’s buildings. If these are the largest U.S. buildings (> 44,000 sf) then this would represent about 52% of the gsf of the U.S. commercial building stock. Instead, Portfolio Manager contains only 40% of the total U.S. gross square footage. This means that Portfolio Manager must have data for about 80% of the nation’s buildings that are 45,000 sf or larger and only a tiny fraction of the buildings that are smaller.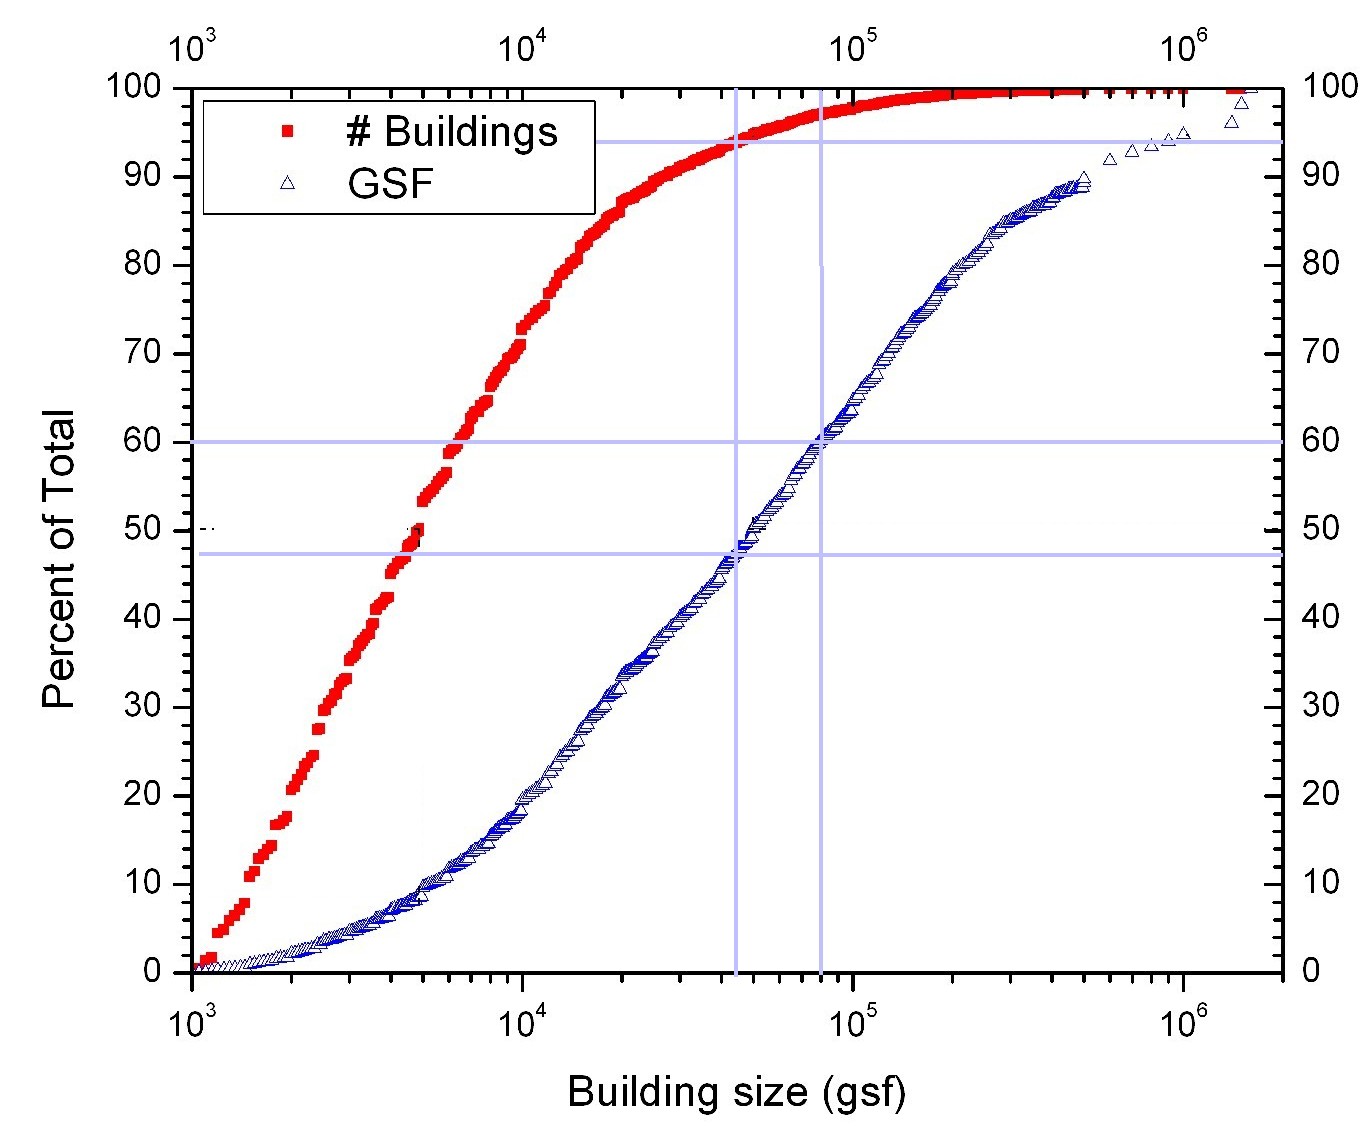
Conclusion — Portfolio Manager and ENERGY STAR benchmarking is dominated by the nation’s largest buildings.
This raises concerns on several levels. It turns out that the model that EPA uses for calculating Energy Star scores involves political decisions — what energy to allow for. In moving from its 2003 to its 2007 Office model these decisions specifically enhanced the score for large office buildings — making it more attractive for large buildings to adopt Energy Star.
Secondly, the average ENERGY STAR score for all buildings that have submitted data to Portfolio Manager is said to be 62. The supposed meaning of the ENERGY STAR score is a building’s percentile ranking as compared with similar buildings. If this is the case then the mean ENERGY STAR score for all large buildings should be 50. But if 80% of large buildings are in Portfolio Manager — how can their mean score be 62? This might have seemed plausible if only a small fraction of large buildings were scored — but with such a large fraction is suggests a kind of “grade inflation.” Apparently the ENERGY STAR score does not mean what we are told it means.
