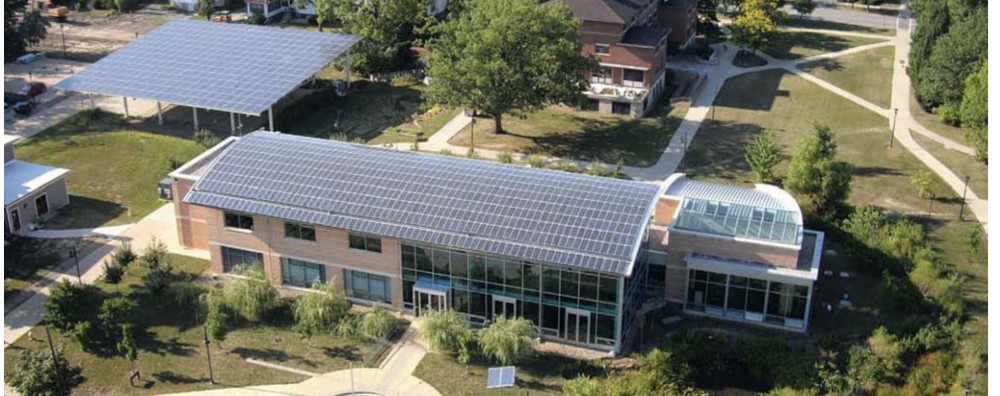
In this post I want to talk about the cost-effectiveness of retrofitting my 3-bedroom house in Pemaquid with mini-split heat pumps. Four years ago, just before I had our first mini-split installed, the house was heated with electric resistive, baseboard heaters. The house was shut down in the winter (water drained, heat turned off) so these heaters were used sparingly in spring and fall. We spent our first winter here four years ago so decided to invest at that time in one mini-split heat pump that served the central living area.
We now have four single-zone, mini-split heat pumps installed, a 15 kBtu/h unit for the main living space and three smaller units (6 kBtu/h, 9 kBtu/h, and 9 kBtu/h) in an office and two bedrooms. Electric baseboard heat remains the only heat in the third bedroom — but my wife likes a cold bedroom so we NEVER use that electric heater. We regularly use a small, 1.5 kW ceramic electric heater in the bathroom — this heater runs about 1 hour a day.
The heat pumps provide summer cooling, but this is not their main function. They were installed to lower our heating cost. Electricity is expensive here in Maine and I was led to believe that heat pumps would use about 1/3 as much energy as the electric resistive heat. Based on my data I find that they are not, on average, that efficient. Instead they use 1/2 the energy (average COP = 2) used by electric heaters.
While I have electric bills from previous years, it would not be useful to compare them with my more recent bills. Everything in the house is electric — hot water heater, stove, clothes dryer, etc. — so with three people now living in this house full time the energy use is too different from what it was in previous years when we only summered here.
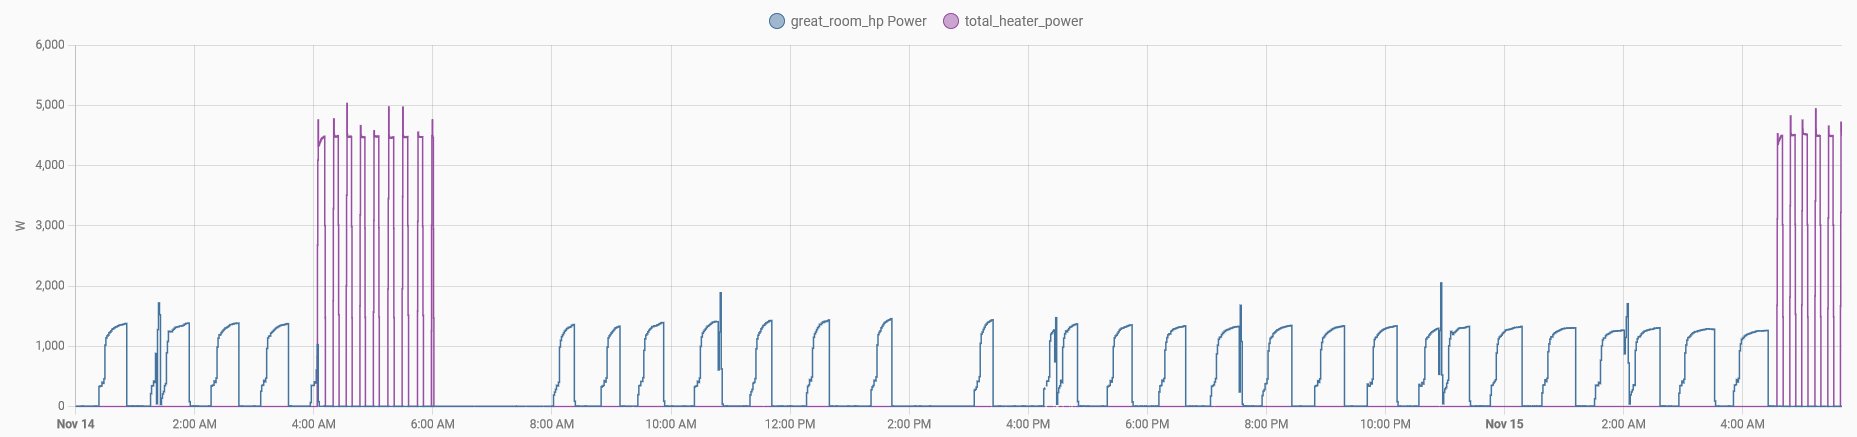
Shortly after installing the heat pumps I installed Iammeter electric power monitors that keep track of their energy use. These devices and their associated cloud storage have been very reliable and I strongly recommend them.
The heat pumps have been installed incrementally over four years. The larger unit was installed in October 2020. After rebate the net cost to me was $3,369. The office unit (6 kBtu/h) was installed in October 2021. After rebate my net cost was $2,789. The two bedrooms units (9 kBtu/h each) were installed in September 2024 after I moved permanently to ME. After rebate my net cost for these two units was $7,800. I am still hopeful that I will receive a $2000 federal tax credit (tbd) which would lower my net cost to $5800. Assuming I do get the tax credit, our net investment in these heat pumps is just about $12,000.
This heating season (Oct. 1 – March 20) all four heat pumps have used 3884 kWh. As I did earlier, I will inflate this a bit (multiply by 7/6) to account for electricity I expect to use for the remaining 6 weeks or so of the heating system. This gives a projected use of 4,500 kWh, which, at $0.25/kWh has a cost of $1,233.
Based on my assessment that the average COP for these heat pumps is 2.0, that means that I expect had I not purchased these heat pumps, I would have supplied this same heat with electric heaters at double the energy use, or a projected cost of $2,266. That means the heat pumps saved me half this amount, or $1,233.
If you divide my capital investment by my annual savings (for just this year, of course) you get a simple payback time of about 10 years. That is the expected lifetime for the heat pumps. Keep in mind that I already had electric baseboard heaters installed. There was no capital investment in continuing to use them.
The return on investment is much worse if I consider only the heat pumps I recently added to the two bedrooms. My daughter keeps her bedroom fairly warm and her door is usually closed. For the heating system her heat pump has used 867 kWh which, multiplied by my 7/6 factor is 1000 kWh. Based on earlier analysis this is the savings as compared with the baseboard electric heat that was formerly in her room — a savings of $253. If I divide the $5,800 cost of these bedroom units by two, then this heat pump cost $2,900 to install. The simple payback is 11.5 years. The savings for our guest bedroom are far lower and the ROI for that much lower.
Investing in these two heat pumps was a bad decision. I think I am happy with my investment in the first two heat pumps — it is not a slam dunk case, but overall I am happy with that initial investment. These two heat pumps have a simple payback time of 7 years.
Of course, there is still the air-conditioning benefit. But this is far less than I had imagined. For the last year’s cooling season (June 1 – Oct. 1) the two house heat pumps used a total of 222 kWh. The two cottage heat pumps for this same period used 80 kWh. In both cases, these heat pumps provided welcomed dehumidification and cooling for some very warm summer days and nights. But this relief could have been easily delivered by much cheaper window air-conditioners.
I realize that this is an over-simplification of cost/benefit analysis. I have not included any maintenance cost. With out-of-control inflation I don’t know how to account for the rapidly increasing cost of the heat pumps nor the increasing cost of electric energy (and other fuels). But I think the basic ideas I have presented are sound. Other smart people might make different assumptions that then produce different conclusions. I think a full discussion is needed.
Note that I have used only my net cost in determining my simple payback time. Someone else pays for the subsidies, and I question whether it is good public policy to encourage people to invest in something that, at full price, is not cost-effective. The subsidizing organization is happy with their return on investment (carbon savings per their invested dollars) and the home-owner is happy with his/her investment. Both claim success while, in fact, the overall investment is not cost-effective. This is an important issue that I have not addressed.
My conclusions rely entirely on my determination that the effective annual heating COP is 2.0, not higher. Many will disagree with this conclusion — but I don’t see any real world data to demonstrate the average COP is higher. Measuring COP in the laboratory under stringent conditions is not the same as evaluating performance in the field with uncontrolled conditions. I have found it very difficult to determine the heat delivered by the heat pumps and have worked hard to nail this down. I have confidence in my measurements. More to come.