As I have indicated, this heating season I will be using my guest house in Maine to study the energy performance of two Mitsubishi mini-split heat pumps. Already some interesting results are emerging. So far this season, with outside temperatures 23°F and above, the heat pumps demonstrate considerable energy (and cost) savings as compared with electric, baseboard heat. My students and I are starting to quantify the savings. Here I report on some preliminary results.
We have three ways to heat the guest house: 1) Two Mitsubishi mini-split heat pumps (one 6kBtu/h and the other 18kBtu/h), 2) A 20,000 Btu/h Rinnai propane vented wall furnace, and 3) three 1.5 kW ceramic electric heaters (together, 15,400 Btu/h) distributed throughout the open space. Each of these three systems has its own remote thermostat. The heat pumps each have a wireless remote thermostat mounted on the wall across the room. The Rinnai is controlled remotely by an Emerson Sensi thermostat, also wall-mounted across the room. And the three ceramic electric heaters are individually plugged into smart outlets that are controlled by Home Assistant using software to mimic a simple on/off thermostat, with temperature measured by a Govee WiFi thermometer sitting on a cabinet near the Sensi thermostat. Because the Govee thermometer reads in 0.1°F increments, it is the common metric used for determining the Cottage inside temperature.
My Home Assistant Heating Dashboard is shown below. All of the heating and monitoring systems can be remotely accessed.

Solar gain is a big factor during the day, so our heating experiments are conducted at night. Last night we heated the guest house for several hours using three of the four heating systems (just used one heat pump). The results are shown below. The first graph shows the Govee temperature from 4 PM yesterday through 10 AM this morning (11/14). Until 4 AM space temperature was maintained by the 18 kBtu/h heat pump. Early yesterday the set point for the heat pump was 65°F but was lowered to 63°F around 6:40 PM yesterday. At 4 AM the heat pump was turned off and the interior temperature was maintained for the next two hours with the three 1.5 kW electric heaters. At 6 AM heat switched from electric to propane. Both the propane and electric heat had set temperatures of 64°F. At 8 AM the propane heat was terminated and control was given back to the 18 kBtu/h heat pump.

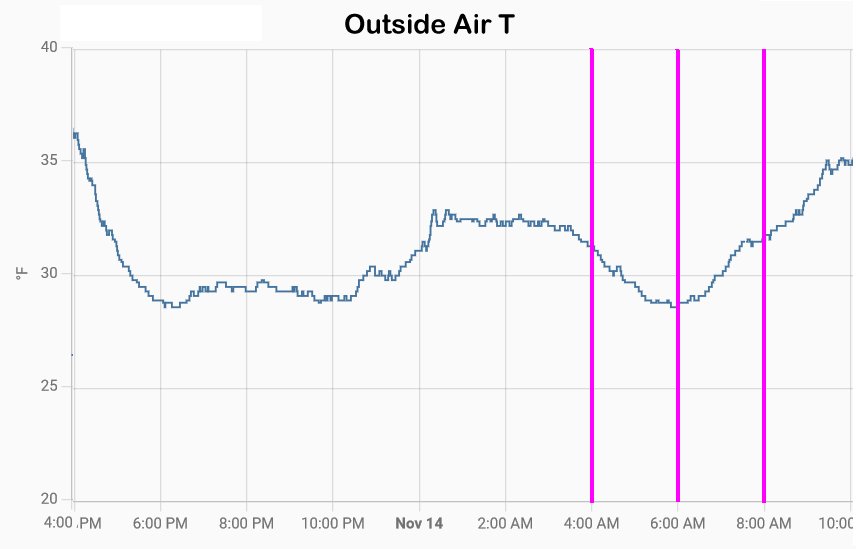
The outside temperature, measured with our Ambient weather station is graphed below. The purple lines indicate when the heating system was changed. From midnight on the outside temperature stayed within 2°F of an average value of about 31°F.
The electric power to the heat pump and the electric heaters were continuously monitored. The average electric power to the heat pump between midnight and 4 AM was 553 Watts. From 4AM to 6AM the electric heaters had an average power of 1830 Watts. That is, the electric heaters used 3.3X the power used by the heat pump. Without adjusting for the change in outside temperature this implies a heating COP = 3.3. This is great news. It means 3.3X lower heating cost than with electric resistive baseboard heat.
But there seems to be a small price to pay for this energy savings. The temperature regulation with the heat pump is not nearly as good as with either of the other two heating systems. The heat pump caused temperature swings of about 2°F while the other two systems have swings of only 1/5th this amount. Moreover, the average temperature maintained by the heat pump is well above its 63°F set point. (Even when you graph the temperature determined by the heat pump’s remote wireless sensor you see that it is always above the set point.) One has to wonder why the control software for the heat pump is not able to do a better job of maintaining the desired temperature. There appears to be no ability to change the “deadband.” for this unit.
We are still working on metering the propane flow in order to understand the energy use for the propane heater. We hope to have this metered soon, it has proven more difficult than we imagined.
But even without metering the propane, I know how much propane should have been burned from 6 – 8AM. From 4-6 AM the electric heaters provided 1.830kW x 2 h = 3.7 kWh of heat. I am paying $0.30/kWh for electric so my cost for this electric is $1.10. 3.7 kWh of energy is equivalent to 12,500 Btu. My propane furnace is rated at 80% efficiency. So to deliver this amount of heat requires that it burn 15,600 Btu of propane. The energy content of a gallon of propane is 91,452 Btu. So I would have had to burn 0.171 gal of propane which, at a cost of $4.29 per gallon, would cost me $0.73.
Hence, 2 hours of heat last night cost me $1.10 using electric heat, $0.73 using propane, and $110/3.3 = $0.33 using the electric heat pump, this with an outside temperature of nearly freezing. The only downside of the heat pump is the lack of temperature control. I am optimistic, however, that we can learn how to use the heat pump better to achieve better control.
One final thing to note is that when I look at the specs for this Mitsubishi compressor, MUZ-FS18N it appears to me that for a wet-bulb outside temperature of about 30°F and a dry-bulb inside temperature of 65°F the heating COP should be 3.21, consistent with my measurement of 3.3.