Energy and GHG emissions savings for U.S. LEED-certified Office buildings

We have completed the largest peer-reviewed study of measured whole building energy use for LEED-certified commercial buildings ever published. Our paper, “Energy and Greenhouse Gas Savings for LEED-Certified U.S. Office Buildings” can be downloaded from the web site of the open access journal Energies. The abstract is found here.

Our study is based on public municipal building energy benchmarking data from 10 US cities for the year 2016. The entire dataset contains annual energy use and energy-related greenhouse gas emission for over 28,000 properties, of which about 4500 are classified as office. By cross-referencing the benchmarking data with the USGBC LEED Project Database we were able to identify 551 office buildings that were certified in LEED systems that address whole building energy use. These systems were LEED for New Construction (NC), Core & Shell (CS), and Existing Buildings (EB). We have compared the 2016 site energy, source energy, electric energy, non-electric energy and greenhouse gas (GHG) emission of these LEED-certified offices other offices in the same cities in order to understand energy savings associated with LEED certification.

In this post I will talk about the site energy savings observed for LEED offices.

LEED offices in every city were found to use less energy on-site than non-LEED offices, adjusting for size, of course. Except for Washington DC, however, the variability in LEED performance was so large that these savings were not statistically-significant at the usual, 95% confidence level. In aggregate, however, the savings were statistically significant. The results are shown in the figure below.


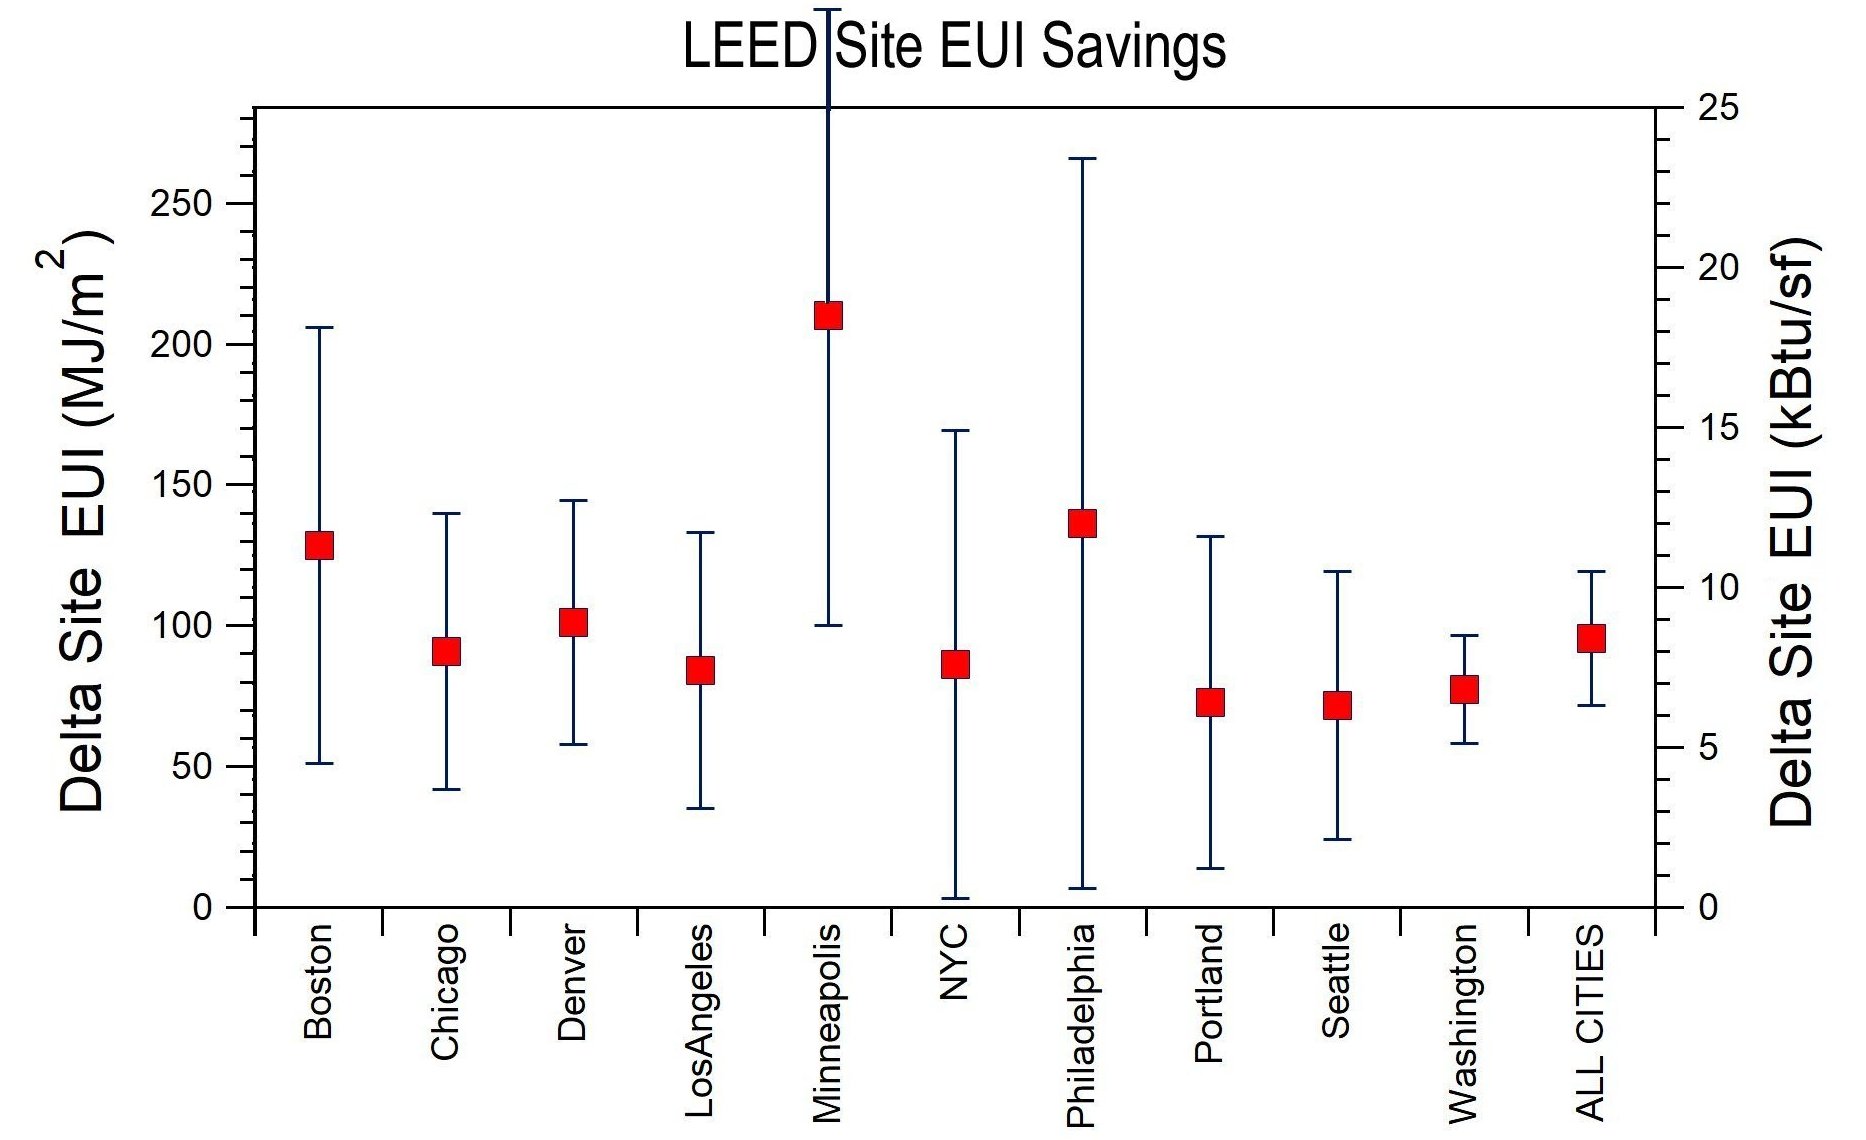
The red symbols indicate savings in site EUI by LEED office buildings relative to other office buildings in the same city. The error bars represent the 1-sigma standard errors in these savings. In aggregate (ALL CITIES) and in Washington DC the savings are two standard deviations or more above zero. In other cities the savings have larger error. In aggregate the LEED site energy savings is 8.5 kBtu/sf, which represents an 11% savings relative to the site EUI for non-LEED offices. These results are consistent with those we have reported earlier based on 2015 data for Chicago.

It should be noted that these savings are substantially lower than the 30-35% energy savings frequently asserted for LEED buildings – but are nonetheless positive and significant.

I will discuss savings in other metrics in upcoming posts.


LEED Platinum Hotel embodies the failings of LEED

Image

On March 14, 2019 the US Green Building Council (USGBC) finally awarded the Hotel at Oberlin its LEED-platinum rating after earning 81 points under the LEED NC v2009 system, just over the 80-point minimum required for the platinum rating.  This milestone comes as a relief to Oberlin College which has for three years falsely claimed the Hotel at Oberlin to be a LEED-platinum building.  But a good day for Oberlin College is a bad day for the US Green Building Council because there is nothing exemplary about the Hotel’s energy performance — it is the very definition of mediocrity.  This latest member of the elite club of LEED-platinum hotels – I think it is the fifth such hotel in the U.S. – uses more energy per square foot than do 75% of other U.S. hotels and uses more natural gas than any other Oberlin College building except its Science Center.

The design team for the Hotel at Oberlin projected that it would annually use 1.43 million kWh of electric energy and 8,350 therms of natural gas.  These energy projections, if realized, would correspond to a site EUI of 56 kBtu/sf and a source EUI of 151 kBtu/sf.  The LEED Scorecard for the building shows that the USGBC awarded the building the maximum possible points for energy efficiency –19 out of 19 possible.

Had the Hotel achieved this projected target energy, however, it would not be an impressive accomplishment.  This target site EUI is still higher than that of 25% of the estimated 30,000 U.S. Hotels  We know about energy use by U.S. Hotels from the 2012 Commercial Building Energy Consumption Survey (CBECS).  The graph below shows the SiteEUI distribution for U.S. Hotels as determined from this survey.  It is clear that the projected site EUI use for the Hotel at Oberlin is lower than 75% of these hotels.  A similar statement can be made about the projected source EUI for the hotel.

More importantly, the Hotel at Oberlin has never achieved this projected energy use figure.  Since opening nearly three years ago the natural gas use has been 4-6 times higher than projected by its design team!  For the last 12 months the electric and natural gas use have been 1,680,000 kWh and 48,000 therms, respectively.  These correspond to annual site and source EUI of 104 and 215 kBtu/sf, respectively.  The graph below shows that this SiteEUI for the Hotel at Oberlin is higher than that of 75% or 22,500 of U.S. Hotels. The energy performance of this LEED Platinum Hotel is worse than mediocre.

The bottom line is that the Hotel at Oberlin, one of only five LEED-platinum hotels in the US, has energy use that is typical of U.S. Hotels — near the middle of the distribution.  There is nothing noteworthy or remarkable about its energy use, either site or source.  Its certification as one of the nation’s most energy-efficient hotels is simply an embarrassment to the USGBC.  It illustrates how meaningless energy efficiency points are for LEED certification.

Harvard Group publishes flawed estimate of the environmental benefits of green buildings

Late last year a group from Harvard’s T. H. Chan School of Public Health published a paper entitled, “Energy savings, emission reductions, and health co-benefits of the green building movement” in Nature’s Journal of Exposure Science & Environmental Epidemiology.  In their paper MacNaughton, Cao, Buonocore, Cedeno-Laurent, Spengler, Bernstein, and Allen consider the cumulative energy savings of some 20,000 commercial buildings, world-wide, that have been certified under the U. S. Green Building Counci’s Leadership in Energy and Environmental Design (LEED) since the program’s inception.  Their focus is to calculate environmental co-benefits associated with this (assumed) energy savings.  Unfortunately their entire thesis is predicated on assumptions that are not supported by facts.  Their paper, masquerading as a peer-reviewed journal article, is little more than a marketing brochure for the USGBC and is devoid of credibility.

MacNaughton et al. make the naive assumption that LEED-certified buildings demonstrate, year after year, the energy savings their design teams predicted during the certification process.  This was essentially the same assumption that underpinned the now-discredited Kats report from 2003.  Numerous studies have shown that buildings in general, and green buildings in particular, use significantly more energy than predicted by their design teams.  This so-called “building performance energy gap” is pervasive and well-documented.  The Harvard paper is entirely based on the results of the 2008 NBI study which has long been discredited.

Frankly these energy-performance assumptions are sophomoric.  The authors cite only three references to support their assumptions — all published a decade ago — and they misrepresent the results of one of these papers — I know, because I wrote it!  They apparently are unaware of upwards of 12 studies published in the last decade that look  at energy performance of LEED buildings.

The Harvard paper should have been rejected in the review process.  If I were at liberty to do so I would publish the reviews of my critique as they affirm essentially all the claims I have made.  One of the Harvard authors served on the Board of the USGBC which should have raised a red flag.  The paper was received by the Journal on October 12, 2017 and accepted for publication five days later.  This accelerated time frame raises questions about the substance of the peer-review process.  And finally, the authors make several factual claims about LEED buildings in their paper that are simply incorrect.

To their credit the editors of this Nature journal allowed me to submit and publish a critique of this Harvard paper.  My paper is entitled, “A critical look at ‘Energy savings, emissions reductions, and health co-benefits of the green building movement.'”  Interested readers should read my critique of the Harvard paper which contains numerous references and relevant facts.


2015 Benchmarking data show LEED-certified buildings in Chicago save no primary energy

As more and more building energy data become available a consistent picture is emerging that shows that LEED-certified buildings use no less primary energy than other buildings.  The latest contribution in this area is a paper soon to be published in Energy and Buildings entitled, “Energy Performance of LEED-Certified Buildings from 2015 Chicago Benchmarking Data.”  This paper compares the annual energy use and green house gas emission for some 130 LEED-certified commercial buildings in Chicago with that of other Chicago buildings in 2015.  Chicago, it turns out, has one of the highest rates of LEED-certification among major U.S. cities.

The data clearly show that the source energy used by LEED-certified offices, K-12 Schools, and multifamily housing is no less than that used by other similar Chicago buildings.  In the case of K-12 Schools, LEED-certified schools actually use 17% more source energy than other schools!

Many studies that address building energy use only discuss energy used on site, called site energy.  We found that LEED-certified buildings in Chicago use about 10% less energy on site than do other similar buildings.  No doubt green building advocates will emphasize this apparent energy savings.

But energy used on site – called site energy – is only part of the story.  Site energy fails to account for the off-site losses incurred in producing the energy and delivering it to the building – particularly important for electric energy that, on average, is generated and distributed with 33% efficiency.  The EPA defines source energy to account for both on- and off-site energy consumption associated with a building; building Energy Star scores are based on source energy consumption.  The issue is similar to one encountered when comparing the environmental impact of electric vehicles with internal combustion vehicles — you must trace the energy back to the electric power sector.

How is it that LEED buildings use less energy on-site than other buildings while consuming more source energy?  Simple — more of their (indirect) energy use occurs off-site in the electric power sector.  They use less natural gas but more electric energy than other buildings.  Essentially a larger fraction of their energy use occurs off-site in the electric power sector.

This is the trend in newer buildings, to use more electric energy and less natural gas or district heat energy.  Part of this is convenience and part of it is driven by the belief, or rather hope, that the electric power sector will soon be dominated by renewable energy.  It is true that the contribution of renewable energy (solar, wind, etc.) in the electric power sector is growing, but this is a very slow process and, for many years to come, natural gas and even coal will remain the dominant source for electricity.

This trend is not unique to LEED buildings — it is present in all new buildings.  When you compare Chicago’s LEED buildings with other Chicago buildings of similar vintage you find that they use similar site and source energy.

Bottom line, 2015 Chicago data show that LEED-certified buildings are not providing any significant reduction in energy use or GHG emission.

These results are similar to those observed earlier for LEED-certified buildings in NYC.

USGBC gives new meaning to Energy Star Score

This weekend I have been gathering data regarding LEED certified buildings made available at the Green Building Information Gateway.  In browsing through the web site I ran across a page that described Top Performing Buildings.  On that page I read this statement:

“One percent of buildings earned an Energy Star Score of 90+”

I don’t know if this statement is true or not — but I am humored by its implications.

According to the EPA, the building Energy Star score is a ranking of a building’s energy efficiency as compared with similar buildings in the U.S. commercial building stock.  It is assumed that the mean or median building score is 50 — simply reflecting the inescapable fact that half U.S. buildings are better than average and half are worse.  This is a necessary consequence of the meaning of a cumulative population distribution!

It also follows that 10% of the buildings necessarily have scores below 11 and 10% have scores higher than 90.

Perhaps it is true that only 1% receive scores that are 90 and higher.  But if true, the score clearly cannot reflect the meaning given it by the EPA.  Perhaps the author of that gbig web page needs to reflect on the meaning his/her/their statement.