EPA Energy Star Review Report Fails to Account for Uncertainties

The other day a friend emailed me a link to the EPA’s April 2019 report of its Review of the Energy Star Hotel benchmarking score.  In a nutshell, after suspending Energy Star Certification for the last six months or so pending a review of its revised methodology, the EPA has issued a report saying their revised methodology is correct and they are resuming operations.  But the statistics reported in this “Analysis and Key Findings” simply confirms what I have documented earlier in my book, that the Energy Star staff do not understand the difference between real trends and random noise.

On page 1 of their report the EPA Energy Star folks publish this table demonstrating how U.S. Lodging buildings have evolved between 2003 and 2012.

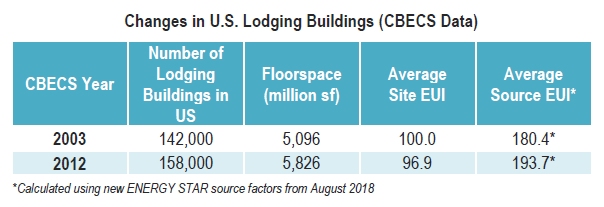
The EPA’s text accompanying this table says, “Between 2003 and 2012, the estimated number of hotel buildings in the United States increased by 14%. During that period, the average site EUI decreased by 3% while the source EUI increased by 7%.”

Presumably these statements are made in order to justify changes in Energy Star scores for Hotels/Motels — the building stock has changed so the relative ranking of a particular building with respect to this building stock will change.  Unfortunately the two EPA claims are false.

The table they used to justify this statement is not for Hotels — it is for all buildings classified by CBECS as Lodging.  This includes hotels, motels, inns, dormitories, fraternities, sororities, nursing home or assisted living, and “other lodging.”  Moreover, when you include the EIA’s relative standard errors (RSE) for both the 2003 and 2012 statistics you find these differences are absolutely meaningless.  In particular, the Site EUI figures for 2003 and 2012 in the above tables are uncertain by 17% (2003) and 8% (2012), respectively.  The differences between the 2003 and 2012 SiteEUI are just as likely to be due to random sampling errors as they are real trends!

The EPA’s Hotel Energy Star model applies only to Hotels and Motels/Inns.  When you look at these CBECS data for 2003 and 2012 you find even larger RSE that swamp any differences.  The relevant statistics are shown in the Table below.  The EIA did not calculate statistics for these two categories in 2003; these numbers are calculated by me using CBECS 2003 microdata.  The EIA did perform the calculations for these categories in 2012.  SourceEUI figures are calculated by me using the EPA’s 2012 site-to-source energy conversion figures (3.14 for electric).  The percentages listed are the RSE’s for each statistic.

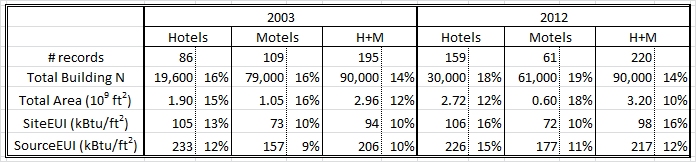
The number of Hotels increased by 50% from 2003 to 2012.  During this same time the number or motels/inns decreased by 23%; their combined number showed no significant change and their combined floor area increased by 8%, hardly resolvable given the uncertainties in these quantities.  The Site and Source EUI for these two types of facilities did not change in any significant way.  The uncertainties in the survey far exceed the small changes in these EUI.  It is impossible to know whether the changes reflect real trends or just sampling errors.

Joelle Michaels, who oversees the CBECS operation, is well aware of the limitations of the CBECS methodology.  It must drive her nuts to see the Energy Star staff present such silly numbers and reports based on CBECS data.

This gets at the heart of my criticism in my book, Building Energy Star scores: good idea, bad science.  The numbers employed by the EPA in their statistical analysis are so uncertain that in most cases they are studying noise and reading into it things that cannot be found.  The science is sophomoric.  It is the result of teaching a little statistics to people who lack the mathematical and scientific knowledge to use it properly.


Hotel at Oberlin — poster child for “Green Wash”

In May 2016 Oberlin College opened its newly constructed Hotel at Oberlin.  The New York Times ranked the Hotel third in its list of 5 Hotels and 5 Tours for the Eco-conciousTraveler.  It is all part of the ongoing marketing effort to paint Oberlin College as a sustainable and green institution.  Hard to believe that any amount of eco-spin can convince people that a view of Oberlin’s Tappan Square is  environmentally rewarding.

Of course what makes the Hotel at Oberlin a green destination is not it surroundings — it is the building itself.  Like the Taj Mahal, committed environmentalists will simply swoon in the presence of this green wonder.  The second (and larger) of Oberlin College’s highly-publicized green buildings, the College has claimed that the Hotel is the first 100% solar powered hotel in the world and one of only five Hotels in the world to win the coveted LEED Platinum rating.  In addition to claims of solar power the building is said to be heated by a geothermal well field and to include other green technologies — including radiant-cooled rooms.  Its web site boldly claims that it has achieved the LEED platinum rating.

Truth is the hotel is not powered by the sun nor is it LEED-certified at any level.

I  wrote about this Hotel nearly two years ago when it opened.  The main focus of that post was to address the solar claim.  I will not rehash the evidence here — please read the blog.  The claim is a brazen and clever lie — Donald Trump would admire its creativity!  Simply stated, the Hotel is no more solar powered than is my century-old home.  There is not one solar panel on the building site.  The 2.2 MW OSSO array that is claimed to power the Hotel was built years before the hotel, is located a mile away, and, by contract, sends all of its electricity to the City of Oberlin until 2037 at a price of $85/MWh.

Today I write to share the Hotel’s energy-performance data and to discuss its LEED rating.  The Hotel is well into its second year of operation and we now have 21 months of utility data.

In my 2016 post I suggested that the Hotel would use two million kWh annually, more than double the 800,000 kWh used by the Oberlin Inn it replaced.  For 2017 the Hotel actually used 1,400,000 kWh of electric energy.  This is 75% more electric energy than was used by the former Oberlin Inn, but less than my estimate.  It is consistent with the annual electric use projected for the Hotel by its design team.

But the Hotel also uses natural gas.  The marketing literature for the Hotel says that the building is heated with ground-source heat pumps.  Natural gas, we are told, is primarily for heating domestic water (laundry, showers, etc.) — available, but not anticipated for backup heat.  The design team projected the annual gas use to be 8,350 therms (Ccf).

In fact, for 2017 the Hotel at Oberlin used 39,000 therms (Ccf), nearly 5X that predicted by the design team.  This is more natural gas than is used by any other Oberlin College building save one — the 130,000 sf Science Center!  The Science Center, constructed 17 years ago, contains numerous research and teaching laboratories and chemical hoods and has never been described as a green building.  It used 58,000 therm of natural gas in FY2017.  The natural gas use of the Hotel at Oberlin exceeds that of any other College building including the Firelands Dormitory (26,000 therm), the new Austin E. Knowlton complex (26,000 therms) and Stevenson Dining Hall (23,000 therms).

How does the Hotel at Oberlin’s energy performance compare with that of other hotels?  Consider its Energy Star score.  This can be estimated using the EPA’s Target Finder web site that allows quick data entry to estimate scores.  Entering the Hotel’s floor area (103,000 sf), number of guest rooms (70), cooking facility (Yes), 100% of the space heated and cooled, and actual FY2017 energy use, and accepting other default parameters, the Hotel at Oberlin is awarded an Energy Star score of 56.  According to the EPA — just a bit above average.  Don’t get me wrong — I am a huge critic of the Energy Star benchmarking score.  But it is one way to compare energy use with other hotels.

The monthly gas usage for the Hotel at Oberlin is shown below.  The excessive use in months Nov. – Feb. is clear evidence that significant gas is used for heating.  But even if you eliminate this heating use, the remaining use is nearly 3X the design estimate.

Finally, let me address the claim that the Hotel at Oberlin is certified LEED Platinum.  It simply is a lie.  I downloaded the USGBC LEED project database today.  The Hotel at Oberlin was registered on March 8, 2013 as “Confidential.”  Its LEED project ID is 1000031165.  As of today, February 23, 2017 the Hotel at Oberlin is not LEED-certified at any level.  The LEED project database says it has achieved 53 points — not enough to even achieve certification at even the Gold level.

Perhaps one day the claims being made for the Hotel at Oberlin will become true.  There is a lesson to be learned by looking at Oberlin’s Green building, generation-I, the Adam Joseph Lewis Center.

Oberlin College’s Adam Joseph Lewis Center  opened in 2000 to much acclaim.  Its proponents claimed it was a zero energy building (ZEB) for more than a decade when it just wasn’t true.  The claims were repeated by two Oberlin College presidents, College literature, and the College web site. The College never issued a retraction — it spent hundreds of thousands of dollars to correct flaws in the building’s HVAC design hoping to lower building energy use to a level that could be met by its 45 kW rooftop PV array.  The College eventually switched from “sticks” to “carrots” and in 2006, with the gift of a million dollars, built a second, 100 kW PV array over the adjacent parking lot and, with tripled electric production, renewed its ZEB claim for the building.  The building continued to use more energy than all of its arrays generated through 2011.  Even when faced with incontrovertible evidence that the claim was false the College continued to print the claim for another year in admissions literature distributed to students.  The College has never issued a public retraction or correction.  In 2012, after hiring a full-time building manager, the building finally used less energy that year than its PV arrays generated.  These arrays now feed two buildings, the AJLC and its adjacent annex.  Energy-intensive functions have been located in the annex and, collectively, these two buildings use more energy than the arrays produce.

Maybe in the next decade the College will build a parking garage next to the Hotel at Oberlin and put a huge PV array on it.  This could make the Hotel at Oberlin solar-powered — but not 100%.  Not sure how it will solve its natural gas problem — but clever minds will think of something.

The era of Donald Trump is here.  It is not illegal to lie, and no lie is too big to sell.

The bottom line is this.  The Hotel at Oberlin is just a normal, expensive hotel that purchases both electricity and natural gas from the local utility companies.  It uses more energy than the hotel it replaced.  It is the perfect symbol of modern green wash — 20 % substance, 60% exaggeration, 20% lies.

USGBC gives new meaning to Energy Star Score

This weekend I have been gathering data regarding LEED certified buildings made available at the Green Building Information Gateway.  In browsing through the web site I ran across a page that described Top Performing Buildings.  On that page I read this statement:

“One percent of buildings earned an Energy Star Score of 90+”

I don’t know if this statement is true or not — but I am humored by its implications.

According to the EPA, the building Energy Star score is a ranking of a building’s energy efficiency as compared with similar buildings in the U.S. commercial building stock.  It is assumed that the mean or median building score is 50 — simply reflecting the inescapable fact that half U.S. buildings are better than average and half are worse.  This is a necessary consequence of the meaning of a cumulative population distribution!

It also follows that 10% of the buildings necessarily have scores below 11 and 10% have scores higher than 90.

Perhaps it is true that only 1% receive scores that are 90 and higher.  But if true, the score clearly cannot reflect the meaning given it by the EPA.  Perhaps the author of that gbig web page needs to reflect on the meaning his/her/their statement.

NYC’s building energy grade discredits both Energy Star and LEED

I receive occasional newsletters from HVAC consultant Larry Spielvogel concerning building energy and the HVAC industry.  Yesterday he sent out a link to an editorial that appeared in Crains New York Business concerning a recent ordinance passed in New York City that “forces large buildings to post letter grades reflecting their energy use.”  These grades will apparently be based upon a building’s Energy Star score.

The Crains’ editor is aghast that a fine building like One World Trade Center which is LEED-gold certified, receives only a B grade.  Worse yet, the highly-acclaimed, LEED-platinum One Bryant Park building receives a C grade.  In closing the essay the editor writes, “Slapping a C next to a LEED Platinum rating will discredit both metrics, confuse the public and accomplish nothing.”

He is right on the first two counts but wrong on the third.  This will accomplish something very important, it will further the cause of truth!

It is better that the public be confused by the truth than to be told lies that bring clarity.  Confusion may lead to investigation and resolution.  The City’s new grade is based on the EPA’s building Energy Star score.  As I have shown in multiple venues, this score is largely garbage.  (See, for instance, earlier blogs from 2016-11-21, 2016-12-14, 2015-09-19, or 2014-08-22.)  The scoring system is mostly ad hoc, made up by non-engineers with a political agenda.  Armed with the knowledge acquired in a semester college statistics course they have developed scores that lack basis in building science or engineering .  They mean well — they want to help the environment.  Their approach is to condense building energy efficiency into a single metric that masses can understand and they can control.  But the score is largely meaningless and the DOE building scientists who helped develop the score 15 years ago have long since distanced themselves from this runaway system that lost its connection with reality.

LEED building certification, a system also born with good intentions, has been shown to have little average impact on building energy use!  LEED-certified office buildings in NYC use just as much energy as do other NYC office buildings.  Similar results have been uncovered in Chicago building energy benchmarking data.

The excessive energy used by One Bryant Park (aka The Bank of America Building) has been discussed before.  (See my earlier post and the New Republic article by Sam Roudman.)  For 2016, One Bryant Park had an annual site energy intensity of 211 kBtu/sf, more than twice that of the average NYC office building for 2015 (94 kBtu/sf). (For 2015 its energy use was somehow omitted from NYC’s public disclosure.)  The energy use of One World Trade Center (aka The Freedom Tower) has not appeared in the 2014, 2015, or 2016 NYC disclosures, despite the fact that the building opened in November 2014.  No doubt the Port Authority keeps its energy use secret as a matter of national security.

Nature does not care what awards these buildings have won or the clever technologies their owners have employed.  Nature only cares about total GHG emission and fossil fuel consumption and, by these measures, these buildings are not exemplary.

No doubt these building owners believe they are not responsible for the excessive energy use — it is their tenants.  True or not, it does not matter.  The building and its occupants are judged together.  If the owner is embarrassed — find different tenants.


The Illusions of EUI in Calculating Energy Savings

In the last month I have found the time to begin looking at the 2012 CBECS data released by the EIA last May.

Today I am writing about something I just learned concerning U.S. Worship Facilities.  Here I am looking at the subset of Worship Facilities that meet the criteria stated by the EPA for performing their multivariate regression for the Worship Facility ENERGY STAR model (about 80% of all U.S. Worship Facilities).

In comparing the 2012 and the 2003 CBECS data for Worship Facilities we see there was an estimated 2% increase in the number of these buildings.  As there is an 8-9% uncertainty in the estimated number of these facilities, this increase is  not statistically significant.  The EIA data show that the mean site energy use intensity (EUI) for these facilities actually went down by 15% from 48 to 41 kBtu/sf — and this reduction is statistically significant as it exceeds the 6-8% uncertainty in these figures.  No doubt some government agency will use this reduction to claim success in programs to promote energy efficiency.

But nature is not impressed because total energy used by these buildings actually went up.  The reason — the buildings are, on average, getting bigger!  From 2003 to 2012 the total gross square footage contained in this filtered subset of Worship Facilities increased from 3.2 to 3.8 billion sf, a whopping 23%.  Thus the total site energy used by Worship Facilities grew by 5%.  A similar conclusion can be made for source energy, even with the improved efficiency of the electric power sector over this last decade.

It should be noted that statistics show that the number of Americans who actually go to church declined by about 7% from 2007-2014.  So in a decade when religious worship is decreasing the amount of energy used by Worship Facilities has grown by about 5%.

Bottom line — don’t be fooled by decreases in building EUI.  It is total energy that matters.

New CBECS Data confirm EPA’s K-12 School ENERGY STAR score is nonsense

As I have written before — indeed, the subject of my recent book — my work shows that the EPA’s ENERGY STAR benchmarking scores for most building types are little more than placebos.  The signature feature of the ENERGY STAR benchmarking scores is the assumption that the EPA can adjust for external factors that impact building energy use.  This adjustment is based on linear regression performed on a relatively small dataset.  For most building types this regression dataset was extracted from the Energy Information Administration’s 2003 Commercial Building Energy Consumption Survey (CBECS).  The EPA has never demonstrated that these regressions accurately predict a component of the energy use of the larger building stock.  They simply perform their regression and assume it is accurate in predicting EUI for other similar buidings.

In the last three years I have challenged this assumption by testing whether the EPA regression accurately predicts energy use for buildings in a second, equivalent dataset taken from the earlier, 1999 CBECS.  In general I find these predictions to be invalid.    For one type of building — Supermarkets/Grocery Stores — I find the EPA’s predictions to be no better than those of randomly generated numbers!

In May of this year the EIA released public data for its 2012 Commercial Building Energy Consumption Survey.  These new data provide yet another opportunity to test the EPA’s predictions for nine different kinds of of buildings.  These new data will either validate the EPA’s regression models or confirm my earlier conclusion that they are invalid. Over the next year I will be extracting 2012 CBECS data to again test the nine ENERGY STAR benchmarking models based on CBECS data.

This week I performed the first of these tests for K-12 Schools.  539 records were extracted from the CBECS 2012 data for K-12 Schools representing 230,000 schools totalling 9.2 billion gsf.  After filtering these records based on EPA criteria, 431 records remain, representing a total of 137,000 schools with 8.0 billion gsf.

I performed the EPA’s weighted regression for K-12 Schools on this final dataset and obtained result totally inconsistent with those obtained by the EPA using CBEC 2003 data. Only 3 of the 11 variables identified by the EPA as “significant predictors” of building Source EUI for K-12 Schools demonstrated statistical significance with the 2012 data. Numerous other comparisons confirmed that the EPA’s regression demonstrated no validity with this new dataset.

The EPA will no doubt suggest that their model was valid for the 2003 building stock, but not for the 2012 stock — because the stock has changed so much in the intervening 9 years! While this seems plausible, this explanation does not hold water.  First, CBECS 2012 data do not suggest significant change in either the size or energy use of the K-12 School stock.  Moreover, this explanation cannot also explain why the EPA regression was not valid for the 1999 building stock — unless the EPA is to suggest that the stock changes so much in just 4 years to render the regression invalid.  And if that is the EPA position — then why would they even attempt to roll out new ENERGY STAR regression models for K-12 Schools based on 2012 CBECS data more than 4 years after these data were valid?  You can’t have it both ways.  Either the stock changes rather slowly and a 4 year delay is not important or this benchmarking methodology is doomed to be irrelevant from the start.


The more plausible explanation — supported by my study — is that the EPA’s regression is simply based on insufficient data and is not valid — even for the 2003 building stock.  I suggest a regression on a second, equivalent sample from the 2003 stock would yield results that differ from the EPA”s origina regression.  The EPA’s ENERGY STAR scores have not more validity than sugar pills.


“Building ENERGY STAR scores – good idea, bad science” book release

After more than three years in the making I have finally published my book, Building ENERGY STAR scores — good idea, bad science.  This book is a critical analysis of the science that underpins the EPA’s building ENERGY STAR benchmarking score.  The book can be purchased through Amazon.com.  It is also available as a free download at this web site.

rotated

I first began looking closely at the science behind ENERGY STAR scores in late 2012. The issue had arisen in connection with my investigation of energy performance of LEED-certified office buildings in New York City using 2011 energy benchmarking data published by the Mayor’s office.  My study, published in Energy & Buildings, concluded that large (over 50,000 sf) LEED-certified office buildings in NYC used the same amount of energy as did conventional office buildings — no more, no less.  But the LEED-certified office buildings, on average, had ENERGY STAR scores about 10 points higher than did the conventional buildings.  This puzzled me.

So I dug into the technical methodology employed by the EPA for calculating these ENERGY STAR scores.  I began by looking at the score for Office buildings.  Soon thereafter I investigated Senior Care Facilities.  Over the next three years I would dig into the details of ENERGY STAR models for 13 different kinds of buildings. Some preliminary findings were published in the 2014 ACEEE Summer Study on Energy Efficiency in Buildings.  A year later I would present a second paper on this topic at the 2015 International Energy Program Evaluation Conference (IEPEC)  Both of these papers were very limited in scope and simply did not allow the space necessary to include the detailed analysis.  So I decided to write a book that contained a separate chapter devoted to each of the 13-types of buildings.  In time the book grew to 18 chapters and an appendix.

This book is not for the general audience — it is highly technical.  In the future I plan to write various essays for a more general audience that do not contain the technical details. Those interested can turn to this book for the details.

As mentioned above the printed copy of the book is available through Amazon.com. Anyone interested in an electronic copy should send me a request via email with their contact information. Alternately an electronic copy may be downloaded from this web site.

Incidently, the book is priced as low as possible — I do not receive 1 cent of royalty.  The cost is driven by the choice of large paper and color printing — it was just going to be too much work to re-do all the graphs so that they were discernable in black and white!


2012 CBECS show building energy use up from 2003

Last week the U.S. Energy Information Administration (EIA) released summary energy use data from its 2012 Commercial Building Energy Consumption Survey (CBECS).  The EIA reports that, as compared with 2003 results, the energy use intensity (EUI) for all U.S. commercial buildings has decreased by 12%.  They also report that for office buildings and educational buildings EUI have decreased by 16% and 17%, respectively.  These numbers, taken at face value, would appear to be encouraging.

But dig a little deeper and you find there is not much to celebrate.  The first thing to note is that mother nature does not care about energy use intensity.  This is a man-made metric for comparing energy use between buildings of different size. What really matters is total green house gas emission and total fossil fuel consumption.  To arrest global climate change, or at least to stabilize it, will require a global reduction in annual green house gas emission.

The 2012 CBECS data show that the total gross square footage (gsf) of the U.S. commercial building stock has expanded by 21% since 2003.  Its total (site) energy consumption has expanded by 7%.  That’s right — U.S. buildings are using more (not less) energy.  During this same time the U.S. population grew by 7.6%.  If world energy consumption and green house gas emission continues to grow with world population we are doomed!  Energy use in undeveloped countries will grow much faster than population as they increase their standard of living.  This growth is especially notable in India and China.  Developed countries like the US — which already use 5X-10X more energy per capita than non-developed countries — must decrease their energy consumption and green house gas emission.  Yet the U.S. is not even holding steady.

The above figures are based on site energy — not primary or source energy which is what really matters.  Building source energy — which includes the off-site energy use associated with energy generation and transportation — is a better indicator of primary energy consumed by buildings.

I have made crude source energy calculations based on the 2012 CBECS summary data and find that for all U.S. commercial buildings source EUI decreases by only 7% and source EUI for offices and educational buildings decreased by 12 and 13% respectively.

But again, what matters is total primary, or equivalently, source energy consumption.  When you combine these figures with the 21% growth in building gsf you find that the total source energy for all buildings increased by 13% — faster than the rate of population growth!  For offices and educational buildings the increases in source energy were 15 and 8%, respectively.  For offices that is double the rate of U.S. population growth and for educational buildings it is about the same as population growth.

2003 to 2012 is the decade of ENERGY STAR and LEED building certification.  These programs both provide cover for building owners to “feel good” about their ever-growing buildings that consume more energy and produce more green-house gas emission — yet are judged to be “green” and “energy-efficient.”  Proponents of these programs will claim that, while their accomplishments are disappointing, things would be far worse if these programs and their goals did not exist.  I doubt the truth of this assertion.  There is no evidence that ENERGY STAR and LEED-certified buildings are performing any better, on average, than other commercial buildings.  These programs are pretty much a distraction from the important societal goals to reduce green house gas emission.

The 2012 CBECS data also put the EPA’s claims that ENERGY STAR benchmarking is saving energy into perspective.  In 2012 the EPA published marketing literature which claimed that 35,000 buildings that used Portfolio Manager to benchmark for the consecutive years 2008, 2009,, 2010, and 2011 demonstrated a 7% reduction in source EUI over this same time period.  The analysis is sophomoric because they literally average the EUI for these 35,000 buildings rather than calculate their total gross source EUI (as does CBECS) which is the sum of all their source energy divided by the sum of their gsf.  It is entirely possible that the gross EUI for these buildings did not decrease at all while their average showed 7% reduction. The 35,000 buildings in the EPA study is dominated by office buildings — by far the largest set of buildings that use their benchmarking software.  Hence their claim of 7% reduction in source energy over the three year period must be seen in a context in which all U.S. office buildings saw a reduction in source EUI of 12% over a 9 year period.  There is simply little reason to believe that buildings that benchmark perform any better than those that don’t.

Once again real energy performance data cast doubt on energy savings claims for U.S. buildings.


EPA makes a mockery of Freedom of Information Act

In my attempt to understand the EPA’s methodology for calculating ENERGY STAR building benchmarking scores I have frequently requested specific information from the EPA.  Early on I found the EPA to be reluctant to share anything with me that was not already publicly released by the agency.  Dissatisfied with this lack of transparency I decided to formally request information from the EPA through the Freedom of Information Act (FOIA) process.  I filed my first FOIA request in March of 2013.  I have since filed about 30 such requests.

The Freedom of Information Act requires that a Federal agency respond to such requests within 20 working days.  If the Agency fails to comply you can file a law suit with the Federal Courts and be virtually guaranteed a summary judgement ordering the Agency to release the requested documents.  Of course the courts move at a snail’s pace so you cannot expect this process to produce documents anytime soon, or even to get the courts to take action in a rapid time frame.

The EPA keeps track of its statistics at addressing FOIA requests.  It has devised two tracks for such requests, a Simple Track and a Complex Track in which requests are sorted.  EPA policy is to make every attempt to respond to simple FOIA requests within the statutory 20 day time frame.  Complex FOIA requests take longer time to locate documents and process them for public release.  For instance, if you request all of Hillary Clinton’s emails it will take time to locate them and to eliminate any portions that might be classified.

The EPA has also adopted a first in-first out policy for processing FOIA requests from a particular requester.  So, if I already have a complex FOIA request in the queue and I file a second, complex FOIA request, it is the EPA’s policy to complete processing of the first request before turning to the second request.  The same policy applies to any requests in the Simple Track.  But it is EPA policy to treat these two tracks independently.  Meaning that if I have a pending FOIA request in the Complex Track queue and subsequently file a Simple FOIA request, the EPA’s policy is to work on these two requests in parallel.  That is, it will not hold up a Simple FOIA request in order to complete a Complex request that was filed earlier.

I have a Complex FOIA request with the EPA that has been outstanding for nearly two years.  I have no expectation that the EPA will respond to this request unless I seek assistance from the courts.  They are simply intransigent.  This action, combined with the EPA’s first in-first out policy means that the EPA will not process any other complex FOIA requests from me unless I get the courts involved.

On August 9, 2015 I filed a FOIA request with the EPA to provide me with copies of 11 documents that summarize the development and revision of the EPA’s Senior Care Facility ENERGY STAR building model.  I know these documents exist because earlier I received an EPA document entitled, “ENERGY STAR Senior Care Energy Performance Scale Development,” an EPA document that serves as a Table of Contents for documents associated with the development of this model.  This request requires no searching as the requested documents are specifically identified, readily available, and cannot possibly raise national security issues.  Yet the EPA placed this request in its “Complex Track” and provided no response to me for more than 20 days.

On September 14, 2015, having received no response I filed what is called an “Administrative Appeal” to ask the Office of General Counsel to intercede to force the agency to produce the requested documents.  In my appeal I pointed out that my FOIA request was, by very definition, simple, and thus EPA policy required the Agency to act on this request within the 20 day statuatory period.  By Law the EPA has 20 working days to decide an Administrative Appeal.

On Friday, October 30, 2015 the EPA rendered a ruling on my Administrative Appeal.  The ruling is simple — the Office of General Counsel directs the Agency, within 20 working days, to respond to my initial request.  Think of it, 58 working days (two and a half months) after I filed my initial FOIA request — a request which by law should have been responded to within 20 working days, the EPA has now been told by the Office of General Counsel to respond to my request within 20 working days.  What a farse!


ENERGY STAR building models fail validation tests

Last month I presented results of research demonstrating that regressions used by the EPA in 6 of the 9 ENERGY STAR building models based on CBECS data are not reproducible in the larger building stock.  What this means is that ENERGY STAR scores built on these regressions are little more than ad hoc scores that have no physical significance.  By that I mean the EPA’s 1-100 building benchmarking score ranks a building’s energy efficiency using the EPA’s current rules, rules which are arbitrary and unrelated to any important performance trends found in the U.S. Commercial building stock.  Below you will find links to my paper as well as power point slides/audio of my presentation.

This last year my student, Gabriel Richman, and I have been devising methods using the R-statistics package to test the validity of the multivariate regressions used by the EPA for their ENERGY STAR building models.  We developed computer programs to internally test the validity of regressions for 13 building models and to externally test the validity of 9 building models.  The results of our external validation tests were presented at the 2015 International Energy Program Evaluation Conference, August 11-13 in Long Beach, CA.  My paper, “Results of validation tests applied to seven ENERGY STAR building models” is available online.  The slides for this presentation may be downloaded and the presentation (audio and slides) may be viewed online.

The basic premise is this.  Anyone can perform a multivariate linear regression on a data set and demonstrate that certain independent variables serve as statistically-significant predictors of a dependent variable which, in the case of EPA building models, is the annual source energy use intensity or EUI.  The point in such regressions, however, is not to predict EUI for buildings within this data set — the point is to use the regression to predict EUI for other buildings outside the data set.  This is, of course, how the EPA uses its regression models — to score thousands of buildings based on a regression performed on a relatively small subset of buildings.

In general there is no a priori reason to believe that such a regression has any predictive value outside the original data on which it is based.  Typically one argues that the data used for the regression are representative of a larger population and therefore it is plausible that the trends uncovered by the regression must also be present in that larger population.  But this is simply an untested hypothesis.  The predictive power must be demonstrated through validation.  External validation involves finding a second representative data set, independent from the one used to perform the regression, and to demonstrate the accuracy of the original regression in predicting EUI for buildings in this second data set.  This is often hard to do because one does not have access to a second, equivalent data set.

Because the EIA’s Commercial Building Energy Consumption Survey (CBECS) is not simply a one-time survey, there are other vintages of this survey to supply a second data set for external validation.  This is what allowed us to perform external validation for the 9 building models that are based on CBECS data.  Results of external validation tests for the two older models were presented at the 2014 ACEEE Summer Study on Energy Use in Buildings and were discussed in a previous blog post.  Tests for the 7 additional models are the subject of today’s post and my recent IEPEC paper.

If the EUI predicted by the EPA’s regressions are real and reproducible then we would expect that a regression performed on the second data set would yield similar results — that is, similar regression coefficients, similar statistical significance for the independent variables, and would predict similar EUI values when applied to the same buildings (i.e., as compared with the EPA regression).  Let the EPA data set be data set A and let our second, equivalent data set be data set B.  We will use the regression on data set A to predict EUI for all the buildings in the combined data se, A+B.  Call these predictions pA.  Now we use the regression on data set B to predict EUI for all these same buildings (data sets A+B) and call these pB.  We expect pA = pB for all buildings, or nearly so, anyway.  A graph of pB vs pA should be a straight line demonstrating strong correlation.

Below is such a graph for the EPA’s Worship Facility model.  What we see is there is essentially no similarity between these two predictions, demonstrating the predictions have little validity.

Worship pBvspA

This “predicted EUI” is at the heart of the ENERGY STAR score methodology.  Without this the ENERGY STAR score would simply be ranking buildings entirely on their source EUI.  But the predicted EUI adjusts the rankings based on operating parameters — so that a building that uses above average energy may still be judged more efficient than average if it has above average operating characteristics (long hours, high worker density, etc.).

What my research shows is this predicted EUI is not a well-defined number, but instead, depends entirely on the subset of buildings used for the regression.  Trends found in one set of buildings are not reproduced in another equally valid set of similar buildings.  The process is analogous to using past stock market values to predict future values.  You can use all the statistical tools available and argue that your regression is valid — yet when you test these models you find they are no better at picking stock winners than are monkeys.

Above I have shown the results for one building type, Worship Facilities.  Similar graphs are obtained when this validation test is performed for Warehouses, K-12 Schools, and Supermarkets.  My earlier work demonstrated that Medical Office and Residence Hall/Dormitories also failed validation tests.  Only the Office model demonstrates strong correlation between the two predicted values pA and pB — and this is only when you remove Banks from the data set.

The release of 2012 CBECS data will provide yet another opportunity to externally validate these 9 ENERGY STAR building models.  I fully expect to find that the models simply have no predictive power with the 2012 CBECS data.