Energy and GHG emissions savings for U.S. LEED-certified Office buildings

We have completed the largest peer-reviewed study of measured whole building energy use for LEED-certified commercial buildings ever published. Our paper, “Energy and Greenhouse Gas Savings for LEED-Certified U.S. Office Buildings” can be downloaded from the web site of the open access journal Energies. The abstract is found here.

Our study is based on public municipal building energy benchmarking data from 10 US cities for the year 2016. The entire dataset contains annual energy use and energy-related greenhouse gas emission for over 28,000 properties, of which about 4500 are classified as office. By cross-referencing the benchmarking data with the USGBC LEED Project Database we were able to identify 551 office buildings that were certified in LEED systems that address whole building energy use. These systems were LEED for New Construction (NC), Core & Shell (CS), and Existing Buildings (EB). We have compared the 2016 site energy, source energy, electric energy, non-electric energy and greenhouse gas (GHG) emission of these LEED-certified offices other offices in the same cities in order to understand energy savings associated with LEED certification.

In this post I will talk about the site energy savings observed for LEED offices.

LEED offices in every city were found to use less energy on-site than non-LEED offices, adjusting for size, of course. Except for Washington DC, however, the variability in LEED performance was so large that these savings were not statistically-significant at the usual, 95% confidence level. In aggregate, however, the savings were statistically significant. The results are shown in the figure below.


The red symbols indicate savings in site EUI by LEED office buildings relative to other office buildings in the same city. The error bars represent the 1-sigma standard errors in these savings. In aggregate (ALL CITIES) and in Washington DC the savings are two standard deviations or more above zero. In other cities the savings have larger error. In aggregate the LEED site energy savings is 8.5 kBtu/sf, which represents an 11% savings relative to the site EUI for non-LEED offices. These results are consistent with those we have reported earlier based on 2015 data for Chicago.

It should be noted that these savings are substantially lower than the 30-35% energy savings frequently asserted for LEED buildings – but are nonetheless positive and significant.

I will discuss savings in other metrics in upcoming posts.


EPA Energy Star Review Report Fails to Account for Uncertainties

The other day a friend emailed me a link to the EPA’s April 2019 report of its Review of the Energy Star Hotel benchmarking score.  In a nutshell, after suspending Energy Star Certification for the last six months or so pending a review of its revised methodology, the EPA has issued a report saying their revised methodology is correct and they are resuming operations.  But the statistics reported in this “Analysis and Key Findings” simply confirms what I have documented earlier in my book, that the Energy Star staff do not understand the difference between real trends and random noise.

On page 1 of their report the EPA Energy Star folks publish this table demonstrating how U.S. Lodging buildings have evolved between 2003 and 2012.

The EPA’s text accompanying this table says, “Between 2003 and 2012, the estimated number of hotel buildings in the United States increased by 14%. During that period, the average site EUI decreased by 3% while the source EUI increased by 7%.”

Presumably these statements are made in order to justify changes in Energy Star scores for Hotels/Motels — the building stock has changed so the relative ranking of a particular building with respect to this building stock will change.  Unfortunately the two EPA claims are false.

The table they used to justify this statement is not for Hotels — it is for all buildings classified by CBECS as Lodging.  This includes hotels, motels, inns, dormitories, fraternities, sororities, nursing home or assisted living, and “other lodging.”  Moreover, when you include the EIA’s relative standard errors (RSE) for both the 2003 and 2012 statistics you find these differences are absolutely meaningless.  In particular, the Site EUI figures for 2003 and 2012 in the above tables are uncertain by 17% (2003) and 8% (2012), respectively.  The differences between the 2003 and 2012 SiteEUI are just as likely to be due to random sampling errors as they are real trends!

The EPA’s Hotel Energy Star model applies only to Hotels and Motels/Inns.  When you look at these CBECS data for 2003 and 2012 you find even larger RSE that swamp any differences.  The relevant statistics are shown in the Table below.  The EIA did not calculate statistics for these two categories in 2003; these numbers are calculated by me using CBECS 2003 microdata.  The EIA did perform the calculations for these categories in 2012.  SourceEUI figures are calculated by me using the EPA’s 2012 site-to-source energy conversion figures (3.14 for electric).  The percentages listed are the RSE’s for each statistic.

The number of Hotels increased by 50% from 2003 to 2012.  During this same time the number or motels/inns decreased by 23%; their combined number showed no significant change and their combined floor area increased by 8%, hardly resolvable given the uncertainties in these quantities.  The Site and Source EUI for these two types of facilities did not change in any significant way.  The uncertainties in the survey far exceed the small changes in these EUI.  It is impossible to know whether the changes reflect real trends or just sampling errors.

Joelle Michaels, who oversees the CBECS operation, is well aware of the limitations of the CBECS methodology.  It must drive her nuts to see the Energy Star staff present such silly numbers and reports based on CBECS data.

This gets at the heart of my criticism in my book, Building Energy Star scores: good idea, bad science.  The numbers employed by the EPA in their statistical analysis are so uncertain that in most cases they are studying noise and reading into it things that cannot be found.  The science is sophomoric.  It is the result of teaching a little statistics to people who lack the mathematical and scientific knowledge to use it properly.


LEED Platinum Hotel embodies the failings of LEED

Image

On March 14, 2019 the US Green Building Council (USGBC) finally awarded the Hotel at Oberlin its LEED-platinum rating after earning 81 points under the LEED NC v2009 system, just over the 80-point minimum required for the platinum rating.  This milestone comes as a relief to Oberlin College which has for three years falsely claimed the Hotel at Oberlin to be a LEED-platinum building.  But a good day for Oberlin College is a bad day for the US Green Building Council because there is nothing exemplary about the Hotel’s energy performance — it is the very definition of mediocrity.  This latest member of the elite club of LEED-platinum hotels – I think it is the fifth such hotel in the U.S. – uses more energy per square foot than do 75% of other U.S. hotels and uses more natural gas than any other Oberlin College building except its Science Center.

The design team for the Hotel at Oberlin projected that it would annually use 1.43 million kWh of electric energy and 8,350 therms of natural gas.  These energy projections, if realized, would correspond to a site EUI of 56 kBtu/sf and a source EUI of 151 kBtu/sf.  The LEED Scorecard for the building shows that the USGBC awarded the building the maximum possible points for energy efficiency –19 out of 19 possible.

Had the Hotel achieved this projected target energy, however, it would not be an impressive accomplishment.  This target site EUI is still higher than that of 25% of the estimated 30,000 U.S. Hotels  We know about energy use by U.S. Hotels from the 2012 Commercial Building Energy Consumption Survey (CBECS).  The graph below shows the SiteEUI distribution for U.S. Hotels as determined from this survey.  It is clear that the projected site EUI use for the Hotel at Oberlin is lower than 75% of these hotels.  A similar statement can be made about the projected source EUI for the hotel.

More importantly, the Hotel at Oberlin has never achieved this projected energy use figure.  Since opening nearly three years ago the natural gas use has been 4-6 times higher than projected by its design team!  For the last 12 months the electric and natural gas use have been 1,680,000 kWh and 48,000 therms, respectively.  These correspond to annual site and source EUI of 104 and 215 kBtu/sf, respectively.  The graph below shows that this SiteEUI for the Hotel at Oberlin is higher than that of 75% or 22,500 of U.S. Hotels. The energy performance of this LEED Platinum Hotel is worse than mediocre.

The bottom line is that the Hotel at Oberlin, one of only five LEED-platinum hotels in the US, has energy use that is typical of U.S. Hotels — near the middle of the distribution.  There is nothing noteworthy or remarkable about its energy use, either site or source.  Its certification as one of the nation’s most energy-efficient hotels is simply an embarrassment to the USGBC.  It illustrates how meaningless energy efficiency points are for LEED certification.

2015 Benchmarking data show LEED-certified buildings in Chicago save no primary energy

As more and more building energy data become available a consistent picture is emerging that shows that LEED-certified buildings use no less primary energy than other buildings.  The latest contribution in this area is a paper soon to be published in Energy and Buildings entitled, “Energy Performance of LEED-Certified Buildings from 2015 Chicago Benchmarking Data.”  This paper compares the annual energy use and green house gas emission for some 130 LEED-certified commercial buildings in Chicago with that of other Chicago buildings in 2015.  Chicago, it turns out, has one of the highest rates of LEED-certification among major U.S. cities.

The data clearly show that the source energy used by LEED-certified offices, K-12 Schools, and multifamily housing is no less than that used by other similar Chicago buildings.  In the case of K-12 Schools, LEED-certified schools actually use 17% more source energy than other schools!

Many studies that address building energy use only discuss energy used on site, called site energy.  We found that LEED-certified buildings in Chicago use about 10% less energy on site than do other similar buildings.  No doubt green building advocates will emphasize this apparent energy savings.

But energy used on site – called site energy – is only part of the story.  Site energy fails to account for the off-site losses incurred in producing the energy and delivering it to the building – particularly important for electric energy that, on average, is generated and distributed with 33% efficiency.  The EPA defines source energy to account for both on- and off-site energy consumption associated with a building; building Energy Star scores are based on source energy consumption.  The issue is similar to one encountered when comparing the environmental impact of electric vehicles with internal combustion vehicles — you must trace the energy back to the electric power sector.

How is it that LEED buildings use less energy on-site than other buildings while consuming more source energy?  Simple — more of their (indirect) energy use occurs off-site in the electric power sector.  They use less natural gas but more electric energy than other buildings.  Essentially a larger fraction of their energy use occurs off-site in the electric power sector.

This is the trend in newer buildings, to use more electric energy and less natural gas or district heat energy.  Part of this is convenience and part of it is driven by the belief, or rather hope, that the electric power sector will soon be dominated by renewable energy.  It is true that the contribution of renewable energy (solar, wind, etc.) in the electric power sector is growing, but this is a very slow process and, for many years to come, natural gas and even coal will remain the dominant source for electricity.

This trend is not unique to LEED buildings — it is present in all new buildings.  When you compare Chicago’s LEED buildings with other Chicago buildings of similar vintage you find that they use similar site and source energy.

Bottom line, 2015 Chicago data show that LEED-certified buildings are not providing any significant reduction in energy use or GHG emission.

These results are similar to those observed earlier for LEED-certified buildings in NYC.

USGBC gives new meaning to Energy Star Score

This weekend I have been gathering data regarding LEED certified buildings made available at the Green Building Information Gateway.  In browsing through the web site I ran across a page that described Top Performing Buildings.  On that page I read this statement:

“One percent of buildings earned an Energy Star Score of 90+”

I don’t know if this statement is true or not — but I am humored by its implications.

According to the EPA, the building Energy Star score is a ranking of a building’s energy efficiency as compared with similar buildings in the U.S. commercial building stock.  It is assumed that the mean or median building score is 50 — simply reflecting the inescapable fact that half U.S. buildings are better than average and half are worse.  This is a necessary consequence of the meaning of a cumulative population distribution!

It also follows that 10% of the buildings necessarily have scores below 11 and 10% have scores higher than 90.

Perhaps it is true that only 1% receive scores that are 90 and higher.  But if true, the score clearly cannot reflect the meaning given it by the EPA.  Perhaps the author of that gbig web page needs to reflect on the meaning his/her/their statement.

NYC’s building energy grade discredits both Energy Star and LEED

I receive occasional newsletters from HVAC consultant Larry Spielvogel concerning building energy and the HVAC industry.  Yesterday he sent out a link to an editorial that appeared in Crains New York Business concerning a recent ordinance passed in New York City that “forces large buildings to post letter grades reflecting their energy use.”  These grades will apparently be based upon a building’s Energy Star score.

The Crains’ editor is aghast that a fine building like One World Trade Center which is LEED-gold certified, receives only a B grade.  Worse yet, the highly-acclaimed, LEED-platinum One Bryant Park building receives a C grade.  In closing the essay the editor writes, “Slapping a C next to a LEED Platinum rating will discredit both metrics, confuse the public and accomplish nothing.”

He is right on the first two counts but wrong on the third.  This will accomplish something very important, it will further the cause of truth!

It is better that the public be confused by the truth than to be told lies that bring clarity.  Confusion may lead to investigation and resolution.  The City’s new grade is based on the EPA’s building Energy Star score.  As I have shown in multiple venues, this score is largely garbage.  (See, for instance, earlier blogs from 2016-11-21, 2016-12-14, 2015-09-19, or 2014-08-22.)  The scoring system is mostly ad hoc, made up by non-engineers with a political agenda.  Armed with the knowledge acquired in a semester college statistics course they have developed scores that lack basis in building science or engineering .  They mean well — they want to help the environment.  Their approach is to condense building energy efficiency into a single metric that masses can understand and they can control.  But the score is largely meaningless and the DOE building scientists who helped develop the score 15 years ago have long since distanced themselves from this runaway system that lost its connection with reality.

LEED building certification, a system also born with good intentions, has been shown to have little average impact on building energy use!  LEED-certified office buildings in NYC use just as much energy as do other NYC office buildings.  Similar results have been uncovered in Chicago building energy benchmarking data.

The excessive energy used by One Bryant Park (aka The Bank of America Building) has been discussed before.  (See my earlier post and the New Republic article by Sam Roudman.)  For 2016, One Bryant Park had an annual site energy intensity of 211 kBtu/sf, more than twice that of the average NYC office building for 2015 (94 kBtu/sf). (For 2015 its energy use was somehow omitted from NYC’s public disclosure.)  The energy use of One World Trade Center (aka The Freedom Tower) has not appeared in the 2014, 2015, or 2016 NYC disclosures, despite the fact that the building opened in November 2014.  No doubt the Port Authority keeps its energy use secret as a matter of national security.

Nature does not care what awards these buildings have won or the clever technologies their owners have employed.  Nature only cares about total GHG emission and fossil fuel consumption and, by these measures, these buildings are not exemplary.

No doubt these building owners believe they are not responsible for the excessive energy use — it is their tenants.  True or not, it does not matter.  The building and its occupants are judged together.  If the owner is embarrassed — find different tenants.


When will the USGBC come clean about their energy data?

Ever since the U.S. Green Building Council (USGBC) certified its first LEED building, questions have been raised as to whether LEED-certified buildings actually save energy.  For years LEED proponents have attempted to answer these questions by putting forward energy simulations — calculations performed by the design team before a building is ever constructed (or renovated) that demonstrate how much energy the proposed building design should save.

The problem is that intentions do not equal performance, and numerous studies of buildings have demonstrated a wide gap between the actual measured energy performance of a building and its design simulations.

I have undertaken several studies that compare the energy performance of LEED-certified buildings with other, similar buildings.  One of the key barriers to such studies is the difficulty in obtaining measured energy performance data for LEED-certified buildings.  Municipal energy benchmarking disclosure laws are beginning to crack this “green wall of silence” but, even so, you will find energy data for only a few hundred LEED-certified buildings in the literature.

One of my regular end-of-the-year rituals is to download the current version of the LEED Project Database posted by the USGBC.  This database lists all registered LEED projects, including information about the LEED system, certification, number of points received, etc.  Below I will share some interesting statistics calculated for these data.

As of December 26, 2017, there are 23,137 LEED-certified commercial buildings (*) in the U.S., certified in programs that address whole-building energy (NC, EB:OM, CS, School).  This is nearly 100X the aforementioned number of LEED-certified buildings whose annual energy consumption have been studied in the peer-reviewed literature.  Obtaining energy performance data is a critical road block to understanding building energy performance.

To address this, the USGBC, starting in 2009 with its version 3 certification programs, instituted a requirement that all LEED-certified buildings must report to the USGBC for five consecutive years following certification, whole building energy use data.  It was hoped that such data would demonstrate the success of the program in saving energy and would guide future improvements in the LEED standard.

So, what have we learned from these data gathered by the USGBC?  We have learned that the USGBC does not want to publicize these data.  Four buildings were certified in version 3 programs in 2010 — so their first year energy performance data would have been reported in 2011.  That number has grown dramatically in successive years.  The graph below shows the total number of buildings certified in relevant LEED.v3 or LEED.v4 programs as of January 1 of the year shown.  By January 2017 this number had grown to nearly 10,000.  When 2018 arrives these buildings will have another year of energy use data to report to the USGBC.  Moreover, 1,931 of these buildings certified by the first of 2013 should be reporting their fifth year of energy consumption.  Where are the reports that analyze these data?

So why isn’t the USGBC making these data available for analysis?  The answer is simple — the data show that LEED-certification is not saving the 30-35% energy that the USGBC has claimed for years.  This is no different from General Motors suppressing data that show Corvairs are not safe, tobacco companies hiding data that show cigarettes cause cancer, or the Catholic church protecting priests accused of sexual misconduct.  All organizations, first and foremost, care about self-preservation.

But the LEED project data show another interesting trend.  Again, looking at the commercial LEED systems that address whole-building energy, it is interesting to look at the numbers of U.S. buildings that were certified by year.  This graph is shown below.  The graph shows a trend that you can detect when you talk to builders and building managers.  Interest in LEED is waning.  2013 was the peak year for LEED certifications in the US.  Since that peak the annual number of U.S. commercial buildings receiving LEED certification in these programs has steadily declined.  Builders and property owners are catching on to the fact that LEED buildings are not saving energy, and the novelty of certification is wearing off.

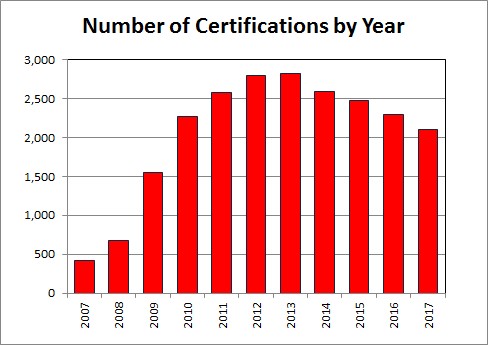
The graph above actually over-estimates the number buildings certified each year.  The reason is that some buildings get certified a second, and even a third time.  These certifications are counted above, even though these “re-certifications” do not add new buildings to the list (just new certifications).

The USGBC, of course, does more than just certify U.S. buildings in the whole-building energy systems considered here.  Marketing green is their strength — they have exported their wares to many other countries and they have invented new LEED certification systems that can make small tenants in large buildings feel good (e.g., commercial interiors, CI).  No doubt global USGBC sales continue to rise.

But make no mistake about it — the core product of energy efficiency is falling flat with U.S. commercial building owners because the product is highly flawed.

* The numbers provided from the LEED project database refer to registered projects.  It is not quite right to say each project corresponds to a building.  A

Hot air emanating from the Windy City

This week Chicago mayor Rahm Emanuel hosted the North American Climate Summit attended by more than 50 mayors from major cities around the globe.  President Obama joined his old Chicago crony to address the summit.  Mayors joined together to sign the Chicago Climate Charter expressing their collective commitment to lower greenhouse gas emissions.

According to an article in HPAC Magazine Chicago Mayor Rahm Emanuel announced that Chicago had “reduced its carbon emissions by eleven percent from 2005 to 2015, bringing the city to forty percent of the way to meeting its Paris Climate
Agreement goals.”

What bullshit!  The same claim can be made by essentially every city in the United States (some more, some less).  This reduction has nothing to do with any unique accomplishments in Chicago — it is due to the simple fact that GHG emissions for the entire US from 2005 to 2015 went down by 11%.  All boats rise with the tide or, in this case, recede.

The main reason for this national GHG reduction is the fact that over the last decade cheap, fracked natural gas has replaced vast amounts of coal in the electric power sector.  This single change is responsible for the majority of the reduction in US greenhouse gas emission this last decade.  It isn’t energy efficiency, green buildings, renewable energy, or conservation — it is the economic impact of cheap natural gas and the increased cost of coal power due to EPA regulations.

Below is a graph lifted from an EPA report showing total US GHG emissions from 1990 through 2014.  The last bar for 2015 (black) was added by me using data pulled from another article.  The blue bars in this graph shows emissions associated with the electric power sector.

Rahm Emanuel’s claim is true but meaningless — just a lot of hot air emanating from the Windy City.

Federal Government Brags about Being Average

I recently ran across a post on the Energy Information Agency (EIA’s) web sit highlighting the fact that from 2003 to 2012 Federal buildings had achieved a greater decrease in energy use intensity than had been achieved by commercial buildings, on average. I find this spin to be offensive on various levels.

The relevant graph is shown below.

2016-09-16-government-building-eui

The first thing to note is that, even with this decrease in energy use Federal buildings still have higher EUI than do other commercial buildings (compare the red and blue 2012 bars).

Second, while I am pleased that the Federal government is learning how to operate its buildings almost as well as the rest of the commercial building sector, it is not a remarkable accomplishment.  It reminds me of a verbal exchange between then Governor Bill Clinton and businessman Ross Perot during a presidential debate.  Clinton was bragging that under his leadership the State of Arkansas had improved its rank among other states in education from almost last up to the middle of the pack.  Ross Perot pointed out that you don’t have to be innovative when you are ranked last — you will move up by just copying what others have done.  (I will confess, this is my memory of what happened, but it might be that I imagined this exchange — it is a good story, in any case.)

Third, why is the EIA engaging in such spin?  This agency is supposed to gather and disseminate energy facts.  Spin should be left to political parties.


The Illusions of EUI in Calculating Energy Savings

In the last month I have found the time to begin looking at the 2012 CBECS data released by the EIA last May.

Today I am writing about something I just learned concerning U.S. Worship Facilities.  Here I am looking at the subset of Worship Facilities that meet the criteria stated by the EPA for performing their multivariate regression for the Worship Facility ENERGY STAR model (about 80% of all U.S. Worship Facilities).

In comparing the 2012 and the 2003 CBECS data for Worship Facilities we see there was an estimated 2% increase in the number of these buildings.  As there is an 8-9% uncertainty in the estimated number of these facilities, this increase is  not statistically significant.  The EIA data show that the mean site energy use intensity (EUI) for these facilities actually went down by 15% from 48 to 41 kBtu/sf — and this reduction is statistically significant as it exceeds the 6-8% uncertainty in these figures.  No doubt some government agency will use this reduction to claim success in programs to promote energy efficiency.

But nature is not impressed because total energy used by these buildings actually went up.  The reason — the buildings are, on average, getting bigger!  From 2003 to 2012 the total gross square footage contained in this filtered subset of Worship Facilities increased from 3.2 to 3.8 billion sf, a whopping 23%.  Thus the total site energy used by Worship Facilities grew by 5%.  A similar conclusion can be made for source energy, even with the improved efficiency of the electric power sector over this last decade.

It should be noted that statistics show that the number of Americans who actually go to church declined by about 7% from 2007-2014.  So in a decade when religious worship is decreasing the amount of energy used by Worship Facilities has grown by about 5%.

Bottom line — don’t be fooled by decreases in building EUI.  It is total energy that matters.