Hot air emanating from the Windy City

This week Chicago mayor Rahm Emanuel hosted the North American Climate Summit attended by more than 50 mayors from major cities around the globe.  President Obama joined his old Chicago crony to address the summit.  Mayors joined together to sign the Chicago Climate Charter expressing their collective commitment to lower greenhouse gas emissions.

According to an article in HPAC Magazine Chicago Mayor Rahm Emanuel announced that Chicago had “reduced its carbon emissions by eleven percent from 2005 to 2015, bringing the city to forty percent of the way to meeting its Paris Climate
Agreement goals.”

What bullshit!  The same claim can be made by essentially every city in the United States (some more, some less).  This reduction has nothing to do with any unique accomplishments in Chicago — it is due to the simple fact that GHG emissions for the entire US from 2005 to 2015 went down by 11%.  All boats rise with the tide or, in this case, recede.

The main reason for this national GHG reduction is the fact that over the last decade cheap, fracked natural gas has replaced vast amounts of coal in the electric power sector.  This single change is responsible for the majority of the reduction in US greenhouse gas emission this last decade.  It isn’t energy efficiency, green buildings, renewable energy, or conservation — it is the economic impact of cheap natural gas and the increased cost of coal power due to EPA regulations.

Below is a graph lifted from an EPA report showing total US GHG emissions from 1990 through 2014.  The last bar for 2015 (black) was added by me using data pulled from another article.  The blue bars in this graph shows emissions associated with the electric power sector.

Rahm Emanuel’s claim is true but meaningless — just a lot of hot air emanating from the Windy City.

NYC Energy Benchmarking Report Over-estimates Energy Savings

The Mayor’s Office in New York City has recently released their annual report looking at the 2013 energy data for commercial buildings.  This is the fourth such report.  Each annual report appears to take longer and longer to prepare suggesting it is easier to gather energy data than to analyze and understand it.

The lead line in this report is that those preparing the report conclude that over a four-year period (2010-2013) green house gases associated with NYC building energy has decreased by 8% and energy use by buildings has decreased by 6%.  They cannot resist suggesting that NYC’s energy benchmarking program can take credit for this reduction.

My analysis of these data show the savings is only half this amount. The other half of the claimed savings is an artifact of the EPA’s having lowered its national, site-to-source energy conversion factor for electricity in Summer 2013.  The same mistake was made by the Washington DC Department of the Environment a year ago.

NYC does not live in a vacuum.  Over the last 10 years expanded use of natural gas and retirement of coal plants has cleaned up the entire U.S. electric grid — of which NYC is a part.  In fact, the purchase of fracked natural gas from Pennsylvania (fracking is outlawed in NY State) is the primary driver of reduced green house gas emission in NYC.  It has little to do with NYC building policies!

The NYC analysis apparently comes from adding up the annual greenhouse gas emission and weatherized source energy use of some 3,000 properties that submitted benchmarking data for all four years.  Using 2010 figures as a baseline the relative annual reductions for these selected properties are graphed below.

report figure 1

Here I want to focus on the source energy curve.  As compared with 2010, energy use went up slightly in 2011, then dropped by nearly 4% in 2012 and another 2.5% in 2013.  The drop in 2012 is easy to understand — hurricane Sandy brought the City to a grinding halt affecting tourism and many operations.  This reduction in energy use should be viewed with great skepticism.  But the continued reduction into 2013 seems like a sign of increased energy efficiency.  Or does it?

Until 2013 the EPA used a site-to-source energy conversion factor for electric energy of 3.34.  In summer 2013 the EPA adjusted this number by 6% to 3.14.  When it generated the 2013 report for NYC it used this reduced site-to-source energy conversion factor.  In other words, the 2013 reduction in NYC’s weather normalized source energy has little to do with building operation and everything to do with the EPA adjusting source energy down for the entire nation!  And this reduction does not reflect the single year improvement in the electric grid.  The EPA made no adjustment to this factor for many years prior to 2013, then in 2013 made a one-time-adjustment to reflect a 5-year average.

The NYC report is based on confidential data — no public benchmarking data were released for 2010.  Nevertheless, I can mimic the analysis by looking only at public NYC benchmarking data for 2011, 2012, and 2013.  In these data I find about 1200 buildings that reported energy data for each of these three years. About 1000 buildings remain after removing any that have questionable data for any of these three years (i.e., site EUI >1000 or <10 kBtu/sf).  The total weather normalized source energy for these buildings is graphed in blue below for each of the three years.  This graph mirrors the trend displayed in the NYC report.  The total site energy for these buildings is graphed in red.  The change in site energy matches the change in source energy for 2012 but not for 2013.  This confirms what I have explained above — that the EPA’s changing site-to-source energy conversion factor for 2013 is responsible for most of the change.  The graph below shows that 2013 site energy was actually higher than 2012 site energy.  It did not go down at all.

relative-energy-savings-scofield

The simple fact is that over the three year period shown below the site energy use of these 1000 buildings went down by only 3.5% — a figure which is highly uncertain given the sample size.  The 6% energy savings claimed by the Mayor’s Office is obtained through faulty analysis.


Jay Whitacre wins 2015 MIT Prize

Today it was announced that Oberlin College physics alumn (and my former student) Jay Whitacre (OC’94) has been awarded the MIT Prize for his inventive work on batteries.  His company, Aquion Energy, has attracted funds from some pretty important investors.  Not bad for a kid who didn’t take calculus in high school.

Jay-Whitacre-Lemelson-MIT_0

Congrats Jay!

Mis-guided investments in energy efficiency and carbon reduction

Yesterday the Wall Street Journal published an article by Greg Ip which summarized the findings of an economic study conducted by Michael Greenstone, Meredith Fowlie and Catherine Wolfram.  (Their original paper is entitled “Do Energy Efficiency Investments Deliver? Evidence from The Weatherization Assistance Program.”)  These researchers looked at the actual energy savings and costs of a specific Weatherization Assistance Program (WAP). What they found was that the homes that took advantage of the WAP only achieved about 40% of the energy savings that engineering calculations had projected.  When they compared the actual savings (not estimated savings) to the costs they concluded 1) that the investments would never pay for themselves (i.e., the cost of the energy saved over 16 years was less than the amount spent on the energy efficiency investments), and 2) the amount of money spent per metric tonne of carbon saved (over these 16 years) is $338/tonne — about 10X more than estimates for the longterm cost to society to solve the carbon emissions problem.

This article caught my attention for two reasons.  First, this simply illustrates again the large gap between measured energy savings and those estimated by promoters of energy effciency programs.  In particular, I have seen this over and over with green buildings.  All the data I have analyzed show that, on average, LEED-certified buildings do not achieve the energy savings that their designers predict.  Many organizations pride themselves on their portfolio of green buildings yet the fact is, these buildings consume no less primary energy than other other buildings.  Society will not arrest climate change with this approach — even though it leads to all kinds of green awards.

But the second reason this caught my attention is due to the parallel these investments have with what is going on in my community of Oberlin, OH.  The Oberlin City Council has made a commitment to make the City climate-positive (I guess it is like giving 110% effort).  Apparently all divisions of the City are instructed to act in accordance with the City’s Climate Action Plan.  The City’s Municipal Power Company has contracted with Efficiency Smart to promote energy efficiency programs for its customers.  Efficiency Smart reports to the City on how much energy its programs have saved — savings that are based on projected estimates not measurements.

A year ago the City had the opportunity to purchase new garbarge/recycling trucks. The City spent an extra $300,000 in order to include hydraulic-hybrid, fuel saving technology in these trucks.  The City Public Works director estimated the deisel fuel savings to be 2,800 gal annually.  At a cost of $3.75/gal this represents an annual return of $10,600 on a $300,000 investment.  Since the trucks are expected to last only 10 years the invesment will never pay for itself.

What about the carbon savings?  If you work through the math you find that the reduced carbon emission (associated with less fuel usage) comes at a cost of about $600 per ton CO2.  This is equivalent to $2,400 per metric tonne carbon savings.  It was an utterly foolish decision to spend money this way.  And this was made based on projected savings.  In a few months we will see how much fuel the trucks have actually used.

City of Oberlin refuse truck

City of Oberlin refuse truck

Don’t get me wrong.  I am an advocate for energy efficiency that leads to real, cost-effective savings.  But there must be a cost/benefit analysis.  We cannot afford to throw money away on schemes that yield such little return.  And we cannot base our decision on “projected” savings.  I like the way that Wal-mart approaches energy efficiency.  Perform the up-front calculation to find the projected savings.  If these look good, retrofit a couple stores and measure the actual savings.  If the trial study confirms the savings — roll out the same changes to all the other stores.  If not, move on.


NYC LEED Office buildings underperform for second year straight

In September 2012 NYC released public data for its first year (2011) of energy benchmarking for large (> 50,000 sf) commercial buildings.  This list included data for roughly 1,000 office/financial buildings.  (Note that the EPA ENERGY STAR building rating system makes no distinction between large office buildings and financial centers — henceforth referred to as office buildings.)  These data were cross-listed with the USGBC LEED project database to identify a subset of 21 LEED office buildings (totaling 24.5 million sf) that were certified before 2011 in one of three LEED programs that should impact energy consumption and green house gas emission — New Construction (NC), Existing Buildings (EB) and Core & Shell (CS).  The energy consumption and GHG emission of these LEED-certified buildings were compared to those for other NYC office buildings and found to be unremarkable.  Specifically, LEED certified office buildings showed no reduction in GHG emission or energy consumption as compared with other NYC office buildings.  This work was summarized previously.  The peer-reviewed publication detailing this work, “Efficacy of LEED-certification in reducing energy consumption and greenhouse gas emission for large New York City office buildings” is published this month in Buildings and Energy Journal.

In October this year NYC released a second year of benchmarking data (2012).  This year’s public disclosure includes buildings classified as condominiums (exempted last year) such as the New York Times building (with two owners).  The question arises — how are LEED-certified office buildings doing in year two?  For 2012 we can now include LEED buildings certified in 2011 (buildings excluded from those studies last year because they were not certified for the entire 2011 year for which energy data were gathered) — in principal yielding an even larger set of LEED-certified buildings.

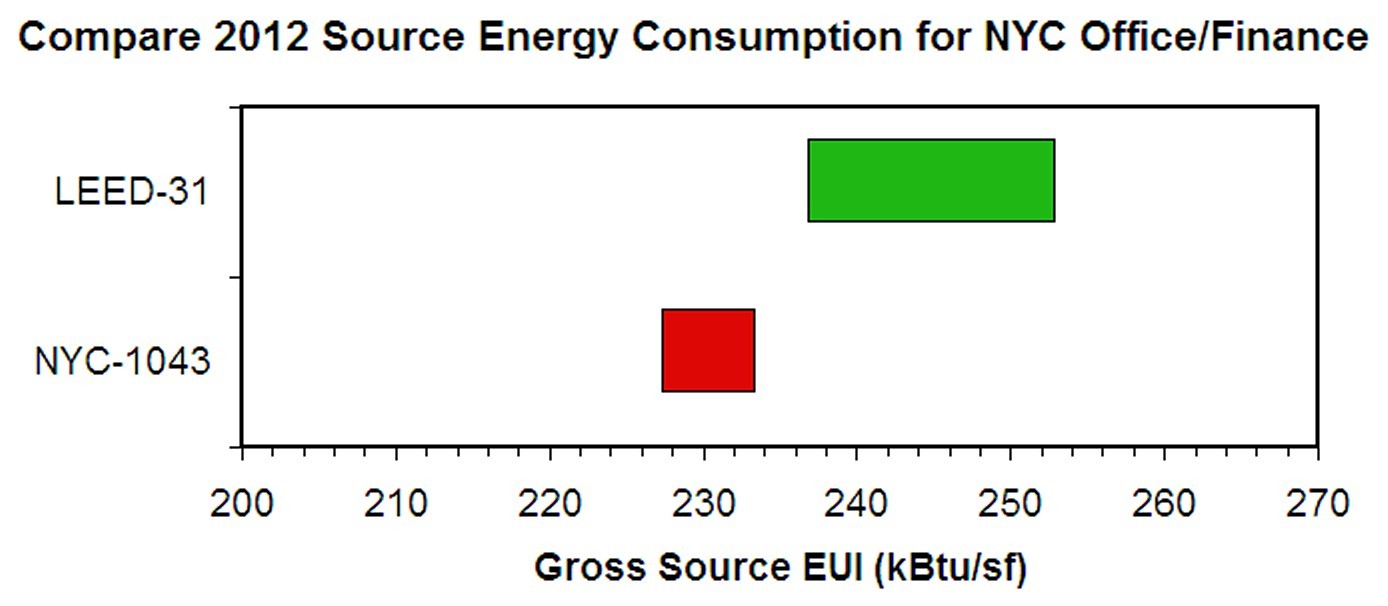
The 2012 NYC benchmarking data includes energy and GHG emission data for 32 large LEED-certified office buildings (totaling 37 million sf).  Collectively these buildings have a gross (weather normalized) source energy use intensity (EUI) of 252 kBtu/sf and a gross site EUI of 104 kBtu/sf.  There GHG emission collectively is 8.9 kg/sf of CO2.  However, the means are skewed by the inclusion of just one building — the Bank of America Tower. This building was also omitted from the previous analysis of 2011 LEED office data.  Omitting this “energy-guzzler” the remaining 31 LEED certified office buildings have a gross (weather normalized) source energy EUI of 245 kBtu/sf and a gross site EUI of 98 kBtu/sf.

When you compare these numbers with the 2011 data for the 21 LEED buildings included in last year’s study you find that, this year, LEED office buildings showed 8% reduction in site energy, 7% reduction in source energy, and 9% reduction in GHG emission.  But are these changes significant and, if so, is this progress to be credited to the LEED buildings?

It turns out that all of these reductions are significant, though probably not at the 95% confidence level (have not completed that calculation).  The uncertainties in the gross site and source EUI for LEED buildings is 6% which means these reductions are slightly higher than “the noise.”

To determine whether these reductions are to be credited to the LEED buildings we need to look at similar numbers for conventional NYC office buildings.  The 2012 gross site and source EUI for the roughly 1,000 NYC office buildings are 92 and 230 kBtu/sf, respectively.  Comparing these to the energy data for the LEED offices we see that in 2012 LEED buildings used 7% more site energy and 6% more source energy than did conventional office buildings (on a per sf basis, of course).  Comparing their gross GHG intensities for 2012 we see that the 32 LEED certified office buildings are responsible for 8% more GHG emissions than conventional NYC office buildings.  The source EUI for the two building sets are compared in the figure below.

Compare LEED31 with NYC1043 Source

Bottom line, for the second year in a row LEED-certified NYC office buildings show no energy or GHG savings as compared with other NYC office buildings.  In fact they use more energy and emit more GHG than other NYC office buildings (on a per sf basis, of course).  These differences are more statistically significant than those between the LEED 2012 and 2011 performances — but need to be nailed down with further calculations.

When you compare the 2012 energy and GHG performance of all NYC office buildings with their performances in 2011 we an average decrease in Site EUI, Source EUI, and GHG emission of 11%, 10%, and 8% respectively.  In other words, the 2012 improvement in LEED performance simply tracks that for other NYC office buildings.  As they say, “all boats rise with the tide” — or in this case, go down with the tide.

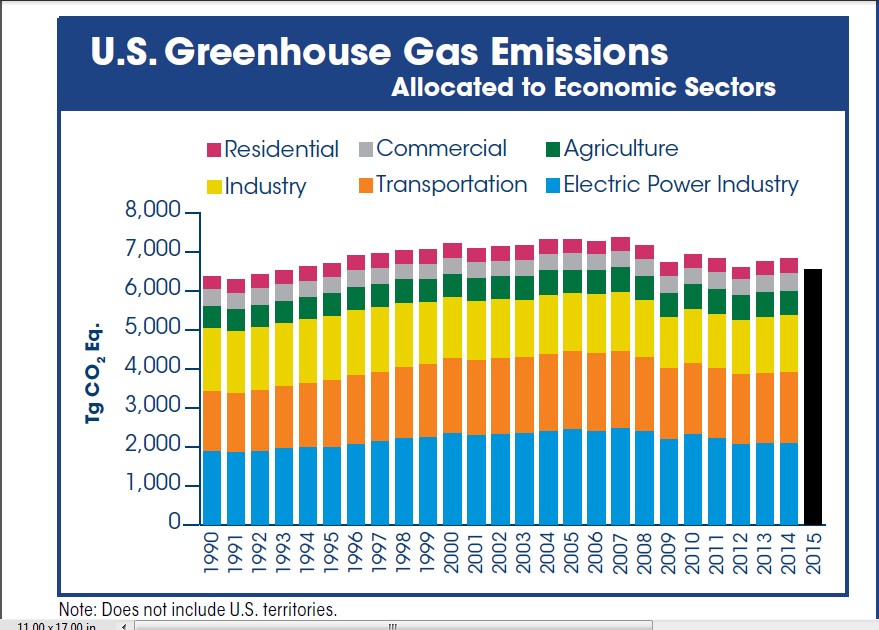
The good news out of the 2012 Energy Benchmarking data is that all NYC office buildings made progress in lowering their GHG emission.  This is likely associated with the steady replacement of coal with natural gas at electric generating plants.  The abundance of natural gas released by fracking is most definitely lowering the carbon content of NYC’s electric supply.  A recent article by Alexis Madrigal describes greater advances yet to come in this area.

There is one more interesting fact about LEED office buildings included in the 2012 NYC benchmarking data.  Five of the 21 LEED office buildings who reported 2011 benchmarking data (the basis for my earlier study) are noticeably missing in the 2012 public benchmarking disclosure.  That means that these five building owners either 1) elected to pay the modest fine to NYC for failure to comply with LL84 or 2) have convinced the city to exempt them from mandatory benchmarking.  Either way this does not bode well for the future of energy transparency.  The USGBC has been collecting annual energy data for buildings certified under its v2009 and later yet publishes none of these data — only selected statistics as part of its marketing literature.  I think we all know what it means when someone invokes the “fifth amendment” and refuses to testify.  The same applies here to refusal to disclose energy data.  It is a good be that owners of really efficient buildings are not refusing to disclose their data.

I should also mention that Luke Rosiak of has published an article in the Washington Examiner regarding what the 2012 NYC Energy Benchmarking data have to say about the performance of LEED buildings as compared to other NYC buildings.  He focuses on Site EUI (rather than Source EUI) and also looks at the relationship between the number of LEED points awarded and Site EUI.  He finds negative correlation — in other words, the buildings that score higher LEED points tend to use relatively more site energy!

A special thanks to Oberlin College student Marisa Aikins for doing most of the work in cross-listing the NYC 2012 benchmarking data with the LEED project database.

EPA Announces Carbon Emission Regulations for new Power Plants

Apparently the EPA has decided to move forward under its own authority to regulate carbon emissions for new power plants — according to an article in yesterday’s New York Times.  The emission standards are said to be 1000 lbs CO2 or new natural gas plants and 1100 lbs CO2 for new coal plants, both per MWh (1000 kWh) of electricity generated.

If you work through the numbers for natural gas that mean that the natural gas plant must be 40% efficient.  This is more efficient than many existing peaking generators in the midwest, but certainly attainable with current technology.  Therefore I think this is a reasonable standard for new natural gas plants.

But new coal plants will not be able to attain this standard through efficiency — they instead will have to capture and store CO2 — and frankly such technology is not demonstrated and available at this level.  Therefore this standard essentially means that no new coal plants will be able to meet the standard for many years to come.

More worrisome is what will be next for existing natural gas and coal plants.  How many years before the EPA extends these regulations to existing plants?