
The Mayor’s Office in New York City has recently released their annual report looking at the 2013 energy data for commercial buildings. This is the fourth such report. Each annual report appears to take longer and longer to prepare suggesting it is easier to gather energy data than to analyze and understand it.
The lead line in this report is that those preparing the report conclude that over a four-year period (2010-2013) green house gases associated with NYC building energy has decreased by 8% and energy use by buildings has decreased by 6%. They cannot resist suggesting that NYC’s energy benchmarking program can take credit for this reduction.
My analysis of these data show the savings is only half this amount. The other half of the claimed savings is an artifact of the EPA’s having lowered its national, site-to-source energy conversion factor for electricity in Summer 2013. The same mistake was made by the Washington DC Department of the Environment a year ago.
NYC does not live in a vacuum. Over the last 10 years expanded use of natural gas and retirement of coal plants has cleaned up the entire U.S. electric grid — of which NYC is a part. In fact, the purchase of fracked natural gas from Pennsylvania (fracking is outlawed in NY State) is the primary driver of reduced green house gas emission in NYC. It has little to do with NYC building policies!
The NYC analysis apparently comes from adding up the annual greenhouse gas emission and weatherized source energy use of some 3,000 properties that submitted benchmarking data for all four years. Using 2010 figures as a baseline the relative annual reductions for these selected properties are graphed below.
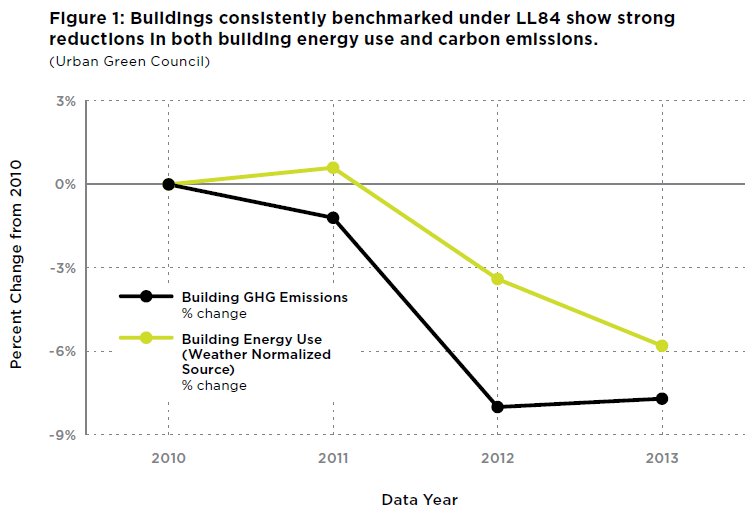
Here I want to focus on the source energy curve. As compared with 2010, energy use went up slightly in 2011, then dropped by nearly 4% in 2012 and another 2.5% in 2013. The drop in 2012 is easy to understand — hurricane Sandy brought the City to a grinding halt affecting tourism and many operations. This reduction in energy use should be viewed with great skepticism. But the continued reduction into 2013 seems like a sign of increased energy efficiency. Or does it?
Until 2013 the EPA used a site-to-source energy conversion factor for electric energy of 3.34. In summer 2013 the EPA adjusted this number by 6% to 3.14. When it generated the 2013 report for NYC it used this reduced site-to-source energy conversion factor. In other words, the 2013 reduction in NYC’s weather normalized source energy has little to do with building operation and everything to do with the EPA adjusting source energy down for the entire nation! And this reduction does not reflect the single year improvement in the electric grid. The EPA made no adjustment to this factor for many years prior to 2013, then in 2013 made a one-time-adjustment to reflect a 5-year average.
The NYC report is based on confidential data — no public benchmarking data were released for 2010. Nevertheless, I can mimic the analysis by looking only at public NYC benchmarking data for 2011, 2012, and 2013. In these data I find about 1200 buildings that reported energy data for each of these three years. About 1000 buildings remain after removing any that have questionable data for any of these three years (i.e., site EUI >1000 or <10 kBtu/sf). The total weather normalized source energy for these buildings is graphed in blue below for each of the three years. This graph mirrors the trend displayed in the NYC report. The total site energy for these buildings is graphed in red. The change in site energy matches the change in source energy for 2012 but not for 2013. This confirms what I have explained above — that the EPA’s changing site-to-source energy conversion factor for 2013 is responsible for most of the change. The graph below shows that 2013 site energy was actually higher than 2012 site energy. It did not go down at all.

The simple fact is that over the three year period shown below the site energy use of these 1000 buildings went down by only 3.5% — a figure which is highly uncertain given the sample size. The 6% energy savings claimed by the Mayor’s Office is obtained through faulty analysis.
