
Last month I presented results of research demonstrating that regressions used by the EPA in 6 of the 9 ENERGY STAR building models based on CBECS data are not reproducible in the larger building stock. What this means is that ENERGY STAR scores built on these regressions are little more than ad hoc scores that have no physical significance. By that I mean the EPA’s 1-100 building benchmarking score ranks a building’s energy efficiency using the EPA’s current rules, rules which are arbitrary and unrelated to any important performance trends found in the U.S. Commercial building stock. Below you will find links to my paper as well as power point slides/audio of my presentation.
This last year my student, Gabriel Richman, and I have been devising methods using the R-statistics package to test the validity of the multivariate regressions used by the EPA for their ENERGY STAR building models. We developed computer programs to internally test the validity of regressions for 13 building models and to externally test the validity of 9 building models. The results of our external validation tests were presented at the 2015 International Energy Program Evaluation Conference, August 11-13 in Long Beach, CA. My paper, “Results of validation tests applied to seven ENERGY STAR building models” is available online. The slides for this presentation may be downloaded and the presentation (audio and slides) may be viewed online.
The basic premise is this. Anyone can perform a multivariate linear regression on a data set and demonstrate that certain independent variables serve as statistically-significant predictors of a dependent variable which, in the case of EPA building models, is the annual source energy use intensity or EUI. The point in such regressions, however, is not to predict EUI for buildings within this data set — the point is to use the regression to predict EUI for other buildings outside the data set. This is, of course, how the EPA uses its regression models — to score thousands of buildings based on a regression performed on a relatively small subset of buildings.
In general there is no a priori reason to believe that such a regression has any predictive value outside the original data on which it is based. Typically one argues that the data used for the regression are representative of a larger population and therefore it is plausible that the trends uncovered by the regression must also be present in that larger population. But this is simply an untested hypothesis. The predictive power must be demonstrated through validation. External validation involves finding a second representative data set, independent from the one used to perform the regression, and to demonstrate the accuracy of the original regression in predicting EUI for buildings in this second data set. This is often hard to do because one does not have access to a second, equivalent data set.
Because the EIA’s Commercial Building Energy Consumption Survey (CBECS) is not simply a one-time survey, there are other vintages of this survey to supply a second data set for external validation. This is what allowed us to perform external validation for the 9 building models that are based on CBECS data. Results of external validation tests for the two older models were presented at the 2014 ACEEE Summer Study on Energy Use in Buildings and were discussed in a previous blog post. Tests for the 7 additional models are the subject of today’s post and my recent IEPEC paper.
If the EUI predicted by the EPA’s regressions are real and reproducible then we would expect that a regression performed on the second data set would yield similar results — that is, similar regression coefficients, similar statistical significance for the independent variables, and would predict similar EUI values when applied to the same buildings (i.e., as compared with the EPA regression). Let the EPA data set be data set A and let our second, equivalent data set be data set B. We will use the regression on data set A to predict EUI for all the buildings in the combined data se, A+B. Call these predictions pA. Now we use the regression on data set B to predict EUI for all these same buildings (data sets A+B) and call these pB. We expect pA = pB for all buildings, or nearly so, anyway. A graph of pB vs pA should be a straight line demonstrating strong correlation.
Below is such a graph for the EPA’s Worship Facility model. What we see is there is essentially no similarity between these two predictions, demonstrating the predictions have little validity.
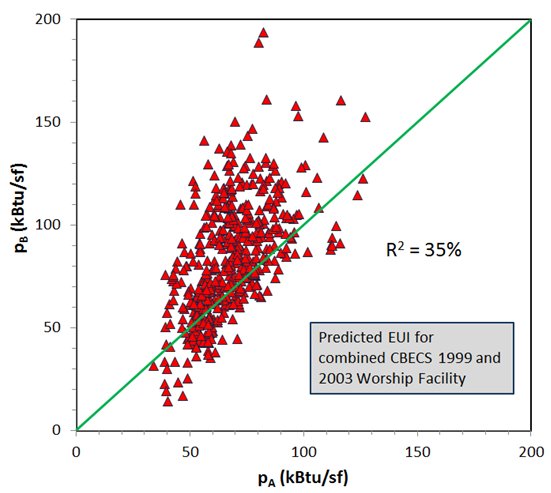
This “predicted EUI” is at the heart of the ENERGY STAR score methodology. Without this the ENERGY STAR score would simply be ranking buildings entirely on their source EUI. But the predicted EUI adjusts the rankings based on operating parameters — so that a building that uses above average energy may still be judged more efficient than average if it has above average operating characteristics (long hours, high worker density, etc.).
What my research shows is this predicted EUI is not a well-defined number, but instead, depends entirely on the subset of buildings used for the regression. Trends found in one set of buildings are not reproduced in another equally valid set of similar buildings. The process is analogous to using past stock market values to predict future values. You can use all the statistical tools available and argue that your regression is valid — yet when you test these models you find they are no better at picking stock winners than are monkeys.
Above I have shown the results for one building type, Worship Facilities. Similar graphs are obtained when this validation test is performed for Warehouses, K-12 Schools, and Supermarkets. My earlier work demonstrated that Medical Office and Residence Hall/Dormitories also failed validation tests. Only the Office model demonstrates strong correlation between the two predicted values pA and pB — and this is only when you remove Banks from the data set.
The release of 2012 CBECS data will provide yet another opportunity to externally validate these 9 ENERGY STAR building models. I fully expect to find that the models simply have no predictive power with the 2012 CBECS data.

Pingback: NYC’s building energy grade discredits both Energy Star and LEED | The Pragmatic Steward