New CBECS Data confirm EPA’s K-12 School ENERGY STAR score is nonsense

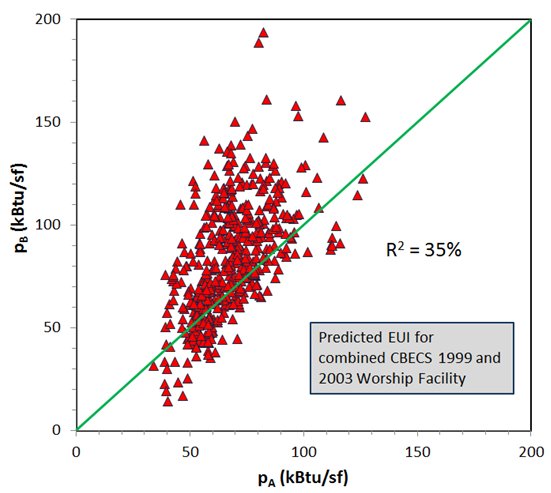
As I have written before — indeed, the subject of my recent book — my work shows that the EPA’s ENERGY STAR benchmarking scores for most building types are little more than placebos.  The signature feature of the ENERGY STAR benchmarking scores is the assumption that the EPA can adjust for external factors that impact building energy use.  This adjustment is based on linear regression performed on a relatively small dataset.  For most building types this regression dataset was extracted from the Energy Information Administration’s 2003 Commercial Building Energy Consumption Survey (CBECS).  The EPA has never demonstrated that these regressions accurately predict a component of the energy use of the larger building stock.  They simply perform their regression and assume it is accurate in predicting EUI for other similar buidings.

In the last three years I have challenged this assumption by testing whether the EPA regression accurately predicts energy use for buildings in a second, equivalent dataset taken from the earlier, 1999 CBECS.  In general I find these predictions to be invalid.    For one type of building — Supermarkets/Grocery Stores — I find the EPA’s predictions to be no better than those of randomly generated numbers!

In May of this year the EIA released public data for its 2012 Commercial Building Energy Consumption Survey.  These new data provide yet another opportunity to test the EPA’s predictions for nine different kinds of of buildings.  These new data will either validate the EPA’s regression models or confirm my earlier conclusion that they are invalid. Over the next year I will be extracting 2012 CBECS data to again test the nine ENERGY STAR benchmarking models based on CBECS data.

This week I performed the first of these tests for K-12 Schools.  539 records were extracted from the CBECS 2012 data for K-12 Schools representing 230,000 schools totalling 9.2 billion gsf.  After filtering these records based on EPA criteria, 431 records remain, representing a total of 137,000 schools with 8.0 billion gsf.

I performed the EPA’s weighted regression for K-12 Schools on this final dataset and obtained result totally inconsistent with those obtained by the EPA using CBEC 2003 data. Only 3 of the 11 variables identified by the EPA as “significant predictors” of building Source EUI for K-12 Schools demonstrated statistical significance with the 2012 data. Numerous other comparisons confirmed that the EPA’s regression demonstrated no validity with this new dataset.

The EPA will no doubt suggest that their model was valid for the 2003 building stock, but not for the 2012 stock — because the stock has changed so much in the intervening 9 years! While this seems plausible, this explanation does not hold water.  First, CBECS 2012 data do not suggest significant change in either the size or energy use of the K-12 School stock.  Moreover, this explanation cannot also explain why the EPA regression was not valid for the 1999 building stock — unless the EPA is to suggest that the stock changes so much in just 4 years to render the regression invalid.  And if that is the EPA position — then why would they even attempt to roll out new ENERGY STAR regression models for K-12 Schools based on 2012 CBECS data more than 4 years after these data were valid?  You can’t have it both ways.  Either the stock changes rather slowly and a 4 year delay is not important or this benchmarking methodology is doomed to be irrelevant from the start.


The more plausible explanation — supported by my study — is that the EPA’s regression is simply based on insufficient data and is not valid — even for the 2003 building stock.  I suggest a regression on a second, equivalent sample from the 2003 stock would yield results that differ from the EPA”s origina regression.  The EPA’s ENERGY STAR scores have not more validity than sugar pills.


“Building ENERGY STAR scores – good idea, bad science” book release

After more than three years in the making I have finally published my book, Building ENERGY STAR scores — good idea, bad science.  This book is a critical analysis of the science that underpins the EPA’s building ENERGY STAR benchmarking score.  The book can be purchased through Amazon.com.  It is also available as a free download at this web site.

rotated

I first began looking closely at the science behind ENERGY STAR scores in late 2012. The issue had arisen in connection with my investigation of energy performance of LEED-certified office buildings in New York City using 2011 energy benchmarking data published by the Mayor’s office.  My study, published in Energy & Buildings, concluded that large (over 50,000 sf) LEED-certified office buildings in NYC used the same amount of energy as did conventional office buildings — no more, no less.  But the LEED-certified office buildings, on average, had ENERGY STAR scores about 10 points higher than did the conventional buildings.  This puzzled me.

So I dug into the technical methodology employed by the EPA for calculating these ENERGY STAR scores.  I began by looking at the score for Office buildings.  Soon thereafter I investigated Senior Care Facilities.  Over the next three years I would dig into the details of ENERGY STAR models for 13 different kinds of buildings. Some preliminary findings were published in the 2014 ACEEE Summer Study on Energy Efficiency in Buildings.  A year later I would present a second paper on this topic at the 2015 International Energy Program Evaluation Conference (IEPEC)  Both of these papers were very limited in scope and simply did not allow the space necessary to include the detailed analysis.  So I decided to write a book that contained a separate chapter devoted to each of the 13-types of buildings.  In time the book grew to 18 chapters and an appendix.

This book is not for the general audience — it is highly technical.  In the future I plan to write various essays for a more general audience that do not contain the technical details. Those interested can turn to this book for the details.

As mentioned above the printed copy of the book is available through Amazon.com. Anyone interested in an electronic copy should send me a request via email with their contact information. Alternately an electronic copy may be downloaded from this web site.

Incidently, the book is priced as low as possible — I do not receive 1 cent of royalty.  The cost is driven by the choice of large paper and color printing — it was just going to be too much work to re-do all the graphs so that they were discernable in black and white!


NYC Energy Benchmarking Report Over-estimates Energy Savings

The Mayor’s Office in New York City has recently released their annual report looking at the 2013 energy data for commercial buildings.  This is the fourth such report.  Each annual report appears to take longer and longer to prepare suggesting it is easier to gather energy data than to analyze and understand it.

The lead line in this report is that those preparing the report conclude that over a four-year period (2010-2013) green house gases associated with NYC building energy has decreased by 8% and energy use by buildings has decreased by 6%.  They cannot resist suggesting that NYC’s energy benchmarking program can take credit for this reduction.

My analysis of these data show the savings is only half this amount. The other half of the claimed savings is an artifact of the EPA’s having lowered its national, site-to-source energy conversion factor for electricity in Summer 2013.  The same mistake was made by the Washington DC Department of the Environment a year ago.

NYC does not live in a vacuum.  Over the last 10 years expanded use of natural gas and retirement of coal plants has cleaned up the entire U.S. electric grid — of which NYC is a part.  In fact, the purchase of fracked natural gas from Pennsylvania (fracking is outlawed in NY State) is the primary driver of reduced green house gas emission in NYC.  It has little to do with NYC building policies!

The NYC analysis apparently comes from adding up the annual greenhouse gas emission and weatherized source energy use of some 3,000 properties that submitted benchmarking data for all four years.  Using 2010 figures as a baseline the relative annual reductions for these selected properties are graphed below.

report figure 1

Here I want to focus on the source energy curve.  As compared with 2010, energy use went up slightly in 2011, then dropped by nearly 4% in 2012 and another 2.5% in 2013.  The drop in 2012 is easy to understand — hurricane Sandy brought the City to a grinding halt affecting tourism and many operations.  This reduction in energy use should be viewed with great skepticism.  But the continued reduction into 2013 seems like a sign of increased energy efficiency.  Or does it?

Until 2013 the EPA used a site-to-source energy conversion factor for electric energy of 3.34.  In summer 2013 the EPA adjusted this number by 6% to 3.14.  When it generated the 2013 report for NYC it used this reduced site-to-source energy conversion factor.  In other words, the 2013 reduction in NYC’s weather normalized source energy has little to do with building operation and everything to do with the EPA adjusting source energy down for the entire nation!  And this reduction does not reflect the single year improvement in the electric grid.  The EPA made no adjustment to this factor for many years prior to 2013, then in 2013 made a one-time-adjustment to reflect a 5-year average.

The NYC report is based on confidential data — no public benchmarking data were released for 2010.  Nevertheless, I can mimic the analysis by looking only at public NYC benchmarking data for 2011, 2012, and 2013.  In these data I find about 1200 buildings that reported energy data for each of these three years. About 1000 buildings remain after removing any that have questionable data for any of these three years (i.e., site EUI >1000 or <10 kBtu/sf).  The total weather normalized source energy for these buildings is graphed in blue below for each of the three years.  This graph mirrors the trend displayed in the NYC report.  The total site energy for these buildings is graphed in red.  The change in site energy matches the change in source energy for 2012 but not for 2013.  This confirms what I have explained above — that the EPA’s changing site-to-source energy conversion factor for 2013 is responsible for most of the change.  The graph below shows that 2013 site energy was actually higher than 2012 site energy.  It did not go down at all.

relative-energy-savings-scofield

The simple fact is that over the three year period shown below the site energy use of these 1000 buildings went down by only 3.5% — a figure which is highly uncertain given the sample size.  The 6% energy savings claimed by the Mayor’s Office is obtained through faulty analysis.


San Francisco PUC Building not so green

SFPUC photoThe San Francisco Public Utilities Commission Administration building, constructed in 2012, has been billed as the greenest office building in North America.  Yesterday the San Francisco Examiner published an article which suggests the declaration was a bit premature.   According to its author, Joshua Sabatini, the $202 million dollar, LEED Platinum building has not performed up to expectations.  The building included integrated photovoltaic panels and wind turbines — enough to provide 7% of the building’s energy (not sure if that is total energy or just electric energy).  The energy produced by the wind turbines was never metered and the wind turbines have already been decommissioned; the company that installed them has filed for bankruptcy.  While the PV panels are reported to have satisfactory performance the inverter room was over-heating, requiring the installation of an auxiliary cooling system.  We will have to take the SFPUC’s word for this result as nowhere can I locate specific information about the expected PV electric generation.  It is so much easier to control the story when you don’t share the facts.

But Sabatini’s article does not discuss the energy performance of this building which is also rather disappointing.  According to 2014 energy benchmarking data published by San Francisco for municipal buildings the 277,511 sf SFPUC building had a measured site EUI of 54 kBtu/sf, just 10% lower than the mean for SF office buildings (60 kBtu/sf).  This is hardly the 32% energy savings claimed on the sfwater.org web site.  Moreover, the source EUI for this building is 153 kBtu/sf, which is 10% higher than the mean for the other 38 municipal office buildings whose 2014 energy data were disclosed.  This “greenest office building in North America” uses 10% more primary energy than used for other municipal office buildings — most of them constructed many years ago.

In other words this LEED Platinum building, the greenest office building in North America, uses 10% more primary energy than its counterparts in the San Francisco municipal building stock.  Sounds like a real winner.

Previously in 2009 I found that LEED-certified office buildings demonstrated modest (about 10%) site energy savings but, owing to their greater reliance on electric energy, demonstrated no significant source energy savings.  The result for the SFPUC building is even worse.

2012 CBECS show building energy use up from 2003

Last week the U.S. Energy Information Administration (EIA) released summary energy use data from its 2012 Commercial Building Energy Consumption Survey (CBECS).  The EIA reports that, as compared with 2003 results, the energy use intensity (EUI) for all U.S. commercial buildings has decreased by 12%.  They also report that for office buildings and educational buildings EUI have decreased by 16% and 17%, respectively.  These numbers, taken at face value, would appear to be encouraging.

But dig a little deeper and you find there is not much to celebrate.  The first thing to note is that mother nature does not care about energy use intensity.  This is a man-made metric for comparing energy use between buildings of different size. What really matters is total green house gas emission and total fossil fuel consumption.  To arrest global climate change, or at least to stabilize it, will require a global reduction in annual green house gas emission.

The 2012 CBECS data show that the total gross square footage (gsf) of the U.S. commercial building stock has expanded by 21% since 2003.  Its total (site) energy consumption has expanded by 7%.  That’s right — U.S. buildings are using more (not less) energy.  During this same time the U.S. population grew by 7.6%.  If world energy consumption and green house gas emission continues to grow with world population we are doomed!  Energy use in undeveloped countries will grow much faster than population as they increase their standard of living.  This growth is especially notable in India and China.  Developed countries like the US — which already use 5X-10X more energy per capita than non-developed countries — must decrease their energy consumption and green house gas emission.  Yet the U.S. is not even holding steady.

The above figures are based on site energy — not primary or source energy which is what really matters.  Building source energy — which includes the off-site energy use associated with energy generation and transportation — is a better indicator of primary energy consumed by buildings.

I have made crude source energy calculations based on the 2012 CBECS summary data and find that for all U.S. commercial buildings source EUI decreases by only 7% and source EUI for offices and educational buildings decreased by 12 and 13% respectively.

But again, what matters is total primary, or equivalently, source energy consumption.  When you combine these figures with the 21% growth in building gsf you find that the total source energy for all buildings increased by 13% — faster than the rate of population growth!  For offices and educational buildings the increases in source energy were 15 and 8%, respectively.  For offices that is double the rate of U.S. population growth and for educational buildings it is about the same as population growth.

2003 to 2012 is the decade of ENERGY STAR and LEED building certification.  These programs both provide cover for building owners to “feel good” about their ever-growing buildings that consume more energy and produce more green-house gas emission — yet are judged to be “green” and “energy-efficient.”  Proponents of these programs will claim that, while their accomplishments are disappointing, things would be far worse if these programs and their goals did not exist.  I doubt the truth of this assertion.  There is no evidence that ENERGY STAR and LEED-certified buildings are performing any better, on average, than other commercial buildings.  These programs are pretty much a distraction from the important societal goals to reduce green house gas emission.

The 2012 CBECS data also put the EPA’s claims that ENERGY STAR benchmarking is saving energy into perspective.  In 2012 the EPA published marketing literature which claimed that 35,000 buildings that used Portfolio Manager to benchmark for the consecutive years 2008, 2009,, 2010, and 2011 demonstrated a 7% reduction in source EUI over this same time period.  The analysis is sophomoric because they literally average the EUI for these 35,000 buildings rather than calculate their total gross source EUI (as does CBECS) which is the sum of all their source energy divided by the sum of their gsf.  It is entirely possible that the gross EUI for these buildings did not decrease at all while their average showed 7% reduction. The 35,000 buildings in the EPA study is dominated by office buildings — by far the largest set of buildings that use their benchmarking software.  Hence their claim of 7% reduction in source energy over the three year period must be seen in a context in which all U.S. office buildings saw a reduction in source EUI of 12% over a 9 year period.  There is simply little reason to believe that buildings that benchmark perform any better than those that don’t.

Once again real energy performance data cast doubt on energy savings claims for U.S. buildings.


EPA makes a mockery of Freedom of Information Act

In my attempt to understand the EPA’s methodology for calculating ENERGY STAR building benchmarking scores I have frequently requested specific information from the EPA.  Early on I found the EPA to be reluctant to share anything with me that was not already publicly released by the agency.  Dissatisfied with this lack of transparency I decided to formally request information from the EPA through the Freedom of Information Act (FOIA) process.  I filed my first FOIA request in March of 2013.  I have since filed about 30 such requests.

The Freedom of Information Act requires that a Federal agency respond to such requests within 20 working days.  If the Agency fails to comply you can file a law suit with the Federal Courts and be virtually guaranteed a summary judgement ordering the Agency to release the requested documents.  Of course the courts move at a snail’s pace so you cannot expect this process to produce documents anytime soon, or even to get the courts to take action in a rapid time frame.

The EPA keeps track of its statistics at addressing FOIA requests.  It has devised two tracks for such requests, a Simple Track and a Complex Track in which requests are sorted.  EPA policy is to make every attempt to respond to simple FOIA requests within the statutory 20 day time frame.  Complex FOIA requests take longer time to locate documents and process them for public release.  For instance, if you request all of Hillary Clinton’s emails it will take time to locate them and to eliminate any portions that might be classified.

The EPA has also adopted a first in-first out policy for processing FOIA requests from a particular requester.  So, if I already have a complex FOIA request in the queue and I file a second, complex FOIA request, it is the EPA’s policy to complete processing of the first request before turning to the second request.  The same policy applies to any requests in the Simple Track.  But it is EPA policy to treat these two tracks independently.  Meaning that if I have a pending FOIA request in the Complex Track queue and subsequently file a Simple FOIA request, the EPA’s policy is to work on these two requests in parallel.  That is, it will not hold up a Simple FOIA request in order to complete a Complex request that was filed earlier.

I have a Complex FOIA request with the EPA that has been outstanding for nearly two years.  I have no expectation that the EPA will respond to this request unless I seek assistance from the courts.  They are simply intransigent.  This action, combined with the EPA’s first in-first out policy means that the EPA will not process any other complex FOIA requests from me unless I get the courts involved.

On August 9, 2015 I filed a FOIA request with the EPA to provide me with copies of 11 documents that summarize the development and revision of the EPA’s Senior Care Facility ENERGY STAR building model.  I know these documents exist because earlier I received an EPA document entitled, “ENERGY STAR Senior Care Energy Performance Scale Development,” an EPA document that serves as a Table of Contents for documents associated with the development of this model.  This request requires no searching as the requested documents are specifically identified, readily available, and cannot possibly raise national security issues.  Yet the EPA placed this request in its “Complex Track” and provided no response to me for more than 20 days.

On September 14, 2015, having received no response I filed what is called an “Administrative Appeal” to ask the Office of General Counsel to intercede to force the agency to produce the requested documents.  In my appeal I pointed out that my FOIA request was, by very definition, simple, and thus EPA policy required the Agency to act on this request within the 20 day statuatory period.  By Law the EPA has 20 working days to decide an Administrative Appeal.

On Friday, October 30, 2015 the EPA rendered a ruling on my Administrative Appeal.  The ruling is simple — the Office of General Counsel directs the Agency, within 20 working days, to respond to my initial request.  Think of it, 58 working days (two and a half months) after I filed my initial FOIA request — a request which by law should have been responded to within 20 working days, the EPA has now been told by the Office of General Counsel to respond to my request within 20 working days.  What a farse!


ENERGY STAR building models fail validation tests

Last month I presented results of research demonstrating that regressions used by the EPA in 6 of the 9 ENERGY STAR building models based on CBECS data are not reproducible in the larger building stock.  What this means is that ENERGY STAR scores built on these regressions are little more than ad hoc scores that have no physical significance.  By that I mean the EPA’s 1-100 building benchmarking score ranks a building’s energy efficiency using the EPA’s current rules, rules which are arbitrary and unrelated to any important performance trends found in the U.S. Commercial building stock.  Below you will find links to my paper as well as power point slides/audio of my presentation.

This last year my student, Gabriel Richman, and I have been devising methods using the R-statistics package to test the validity of the multivariate regressions used by the EPA for their ENERGY STAR building models.  We developed computer programs to internally test the validity of regressions for 13 building models and to externally test the validity of 9 building models.  The results of our external validation tests were presented at the 2015 International Energy Program Evaluation Conference, August 11-13 in Long Beach, CA.  My paper, “Results of validation tests applied to seven ENERGY STAR building models” is available online.  The slides for this presentation may be downloaded and the presentation (audio and slides) may be viewed online.

The basic premise is this.  Anyone can perform a multivariate linear regression on a data set and demonstrate that certain independent variables serve as statistically-significant predictors of a dependent variable which, in the case of EPA building models, is the annual source energy use intensity or EUI.  The point in such regressions, however, is not to predict EUI for buildings within this data set — the point is to use the regression to predict EUI for other buildings outside the data set.  This is, of course, how the EPA uses its regression models — to score thousands of buildings based on a regression performed on a relatively small subset of buildings.

In general there is no a priori reason to believe that such a regression has any predictive value outside the original data on which it is based.  Typically one argues that the data used for the regression are representative of a larger population and therefore it is plausible that the trends uncovered by the regression must also be present in that larger population.  But this is simply an untested hypothesis.  The predictive power must be demonstrated through validation.  External validation involves finding a second representative data set, independent from the one used to perform the regression, and to demonstrate the accuracy of the original regression in predicting EUI for buildings in this second data set.  This is often hard to do because one does not have access to a second, equivalent data set.

Because the EIA’s Commercial Building Energy Consumption Survey (CBECS) is not simply a one-time survey, there are other vintages of this survey to supply a second data set for external validation.  This is what allowed us to perform external validation for the 9 building models that are based on CBECS data.  Results of external validation tests for the two older models were presented at the 2014 ACEEE Summer Study on Energy Use in Buildings and were discussed in a previous blog post.  Tests for the 7 additional models are the subject of today’s post and my recent IEPEC paper.

If the EUI predicted by the EPA’s regressions are real and reproducible then we would expect that a regression performed on the second data set would yield similar results — that is, similar regression coefficients, similar statistical significance for the independent variables, and would predict similar EUI values when applied to the same buildings (i.e., as compared with the EPA regression).  Let the EPA data set be data set A and let our second, equivalent data set be data set B.  We will use the regression on data set A to predict EUI for all the buildings in the combined data se, A+B.  Call these predictions pA.  Now we use the regression on data set B to predict EUI for all these same buildings (data sets A+B) and call these pB.  We expect pA = pB for all buildings, or nearly so, anyway.  A graph of pB vs pA should be a straight line demonstrating strong correlation.

Below is such a graph for the EPA’s Worship Facility model.  What we see is there is essentially no similarity between these two predictions, demonstrating the predictions have little validity.

Worship pBvspA

This “predicted EUI” is at the heart of the ENERGY STAR score methodology.  Without this the ENERGY STAR score would simply be ranking buildings entirely on their source EUI.  But the predicted EUI adjusts the rankings based on operating parameters — so that a building that uses above average energy may still be judged more efficient than average if it has above average operating characteristics (long hours, high worker density, etc.).

What my research shows is this predicted EUI is not a well-defined number, but instead, depends entirely on the subset of buildings used for the regression.  Trends found in one set of buildings are not reproduced in another equally valid set of similar buildings.  The process is analogous to using past stock market values to predict future values.  You can use all the statistical tools available and argue that your regression is valid — yet when you test these models you find they are no better at picking stock winners than are monkeys.

Above I have shown the results for one building type, Worship Facilities.  Similar graphs are obtained when this validation test is performed for Warehouses, K-12 Schools, and Supermarkets.  My earlier work demonstrated that Medical Office and Residence Hall/Dormitories also failed validation tests.  Only the Office model demonstrates strong correlation between the two predicted values pA and pB — and this is only when you remove Banks from the data set.

The release of 2012 CBECS data will provide yet another opportunity to externally validate these 9 ENERGY STAR building models.  I fully expect to find that the models simply have no predictive power with the 2012 CBECS data.


Why does the EPA publish false claims about its Medical Office ENERGY STAR model?

To say that someone “lied” is a strong claim.  It asserts that not only is the statement false but the person making it knows that the statement is false.

The EPA revised and updated its ENERGY STAR Technical Methodology document for Medical Office Buildings in November 2014.  That document makes the following claims:

  1. it describes filters used to extract 82 records from the 1999 CBECS
  2. it claims that the model data contain no buildings less than 5,000 sf in size
  3. with regard to the elimination of buildings < 5000 sf the EPA writes, “Analytical filter – values determined to be statistical outlyers.”
  4. the cumulative distribution for this model from which ENERGY STAR scores are derived is said to be fit with a 2-parameter gamma distribution.

All of the above statements/descriptions are false.  The filters described by the EPA do not produce an 82 record dataset, and the dataset produced do not then have the properties (min, max, and mean) described in Figure 2 of the EPA’s document.  And a regression using the EPA’s variables on the dataset obtained using their stated filters do not produce the results listed in Figure 3 of the EPA’s document.  In short, this EPA document is a work of fiction.

I have published these facts previously in my August 2014 ACEEE paper entitled “ENERGY STAR Building Benchmarking Scores: Good Idea, Bad Science.”  Six months ago I sent copies of this paper to EPA staff responsible for the agency’s ENERGY STAR building program.

I have given the EPA the opportunity to supply facts supporting their claims by filing three Freedom of Information Act (FOIA) requests, the first (EPA-HQ-2013-00927) for the list of 1999 CBECS ID’s that correspond to their 82-building dataset, and the second (EPA-HQ-2013-009668) for the alpha and beta parameters for the gamma distribution that fits their data, and the third (EPA-HQ-2013-010011) for documents justifying their exclusion of buildings <5000 sf from many models, including Medical Offices.  The EPA has closed the first two cases indicating they could not find any documents with the requested information.  17 months after filing the third request it remains open and the EPA has provided no documents pertaining to the Medical Office model.  The EPA is publishing claims for which they have no supporting documents and that I have demonstrated are false.  The details of my analysis are posted on the web and were referenced in my ACEEE paper.

In November 2014 the EPA corrected errors in other Technical Methodology documents yet it saw no need to correct or retract the Medical Office document.  Why is it so hard for the EPA to say they messed up?

It is common for scientists to correct mistakes by publishing “errata” or even withdrawing a previously published paper.  No doubt EPA staff once believed this document they have published was correct.  But how is it possible the EPA remained unaware of the errors while it continued to publish and even revise this document for nearly a decade?  How can the EPA continue to publish such false information six months after it has been informed of the errors?

Is the EPA lying about its Medical Office building model?  I cannot say.  But it is clear that the EPA either has total disregard for the truth or it is incompetent.

If these follks worked for NBC they would have to join Brian Willams on unpaid leave for six months.  Apparently the federal government has a lower standard of competence and/or integrity.

District Department of the Environment premature in claiming energy savings

On January 28, 2015 the District of Columbia published the second year of energy benchmarking data collected from private buildings.  This year’s public disclosure applies to all commercial buildings 100,000 sf and larger while last year’s public disclosure was for all buildings 150,000 sf or bigger.  Data published are drawn from the EPA’s ENERGY STAR Portfolio Manager and include building details such as gsf and principal building activity along with annual consumption for major fuels (electric, natural gas, steam), water, and calculated green house gas emission (associated with fuels).  Also published are annual site EUI (energy use intensity) and weather-normalized source EUI metrics, commonly used to asses building energy use.

The District Department of the Environment has analyzed these two years of data and concluded the following:

  • DC commercial buildings continue to be exceptionally efficient. The median reported ENERGY STAR® score for private commercial buildings in the District was 74 out of 100—well above the national median score of 50.
  • Buildings increased in efficiency from 2012 to 2013. Also,  overall site energy use went up by 1.5% among buildings that reported 2012 and 2013 data. However, when accounting for weather impacts and fuel differences, the weather-normalized source energy use for the same set of buildings decreased by 3% in 2013.

These claims are simply unjustified.

In particular consider the second point — that 2013 source energy used by DC buildings is 3% lower than it was in 2012 — demonstrating improved energy efficiency.  This claim is based on weather-normalized source energy numbers produced by the EPA’s Portfolio Manager.  The problem is that the EPA lowered its site-to-source energy conversion factor for electricity from 3.34 to 3.14 in July 2013 — a 6% reduction.  Because of this simple change, any building that has exactly the same energy purchases for 2013 that it did in 2012 will, according to Portfolio Manager, be using 4-6% less source energy in 2013 (depending on the amount of non-electric energy use).  In other words — the District finds its buildings used 3% less source energy in 2013 than in 2012 when, in fact, by doing nothing, all US buildings saved 5-6% in source energy over this same time frame.

It is said that “a rising tide lifts all boats.”  In this case the Washington DC boat did not rise quite as much as other boats.

More seriously, such small differences (1% – 3%) in average site or source energy are not resolvable within the statistical uncertainty of these numbers.  The standard deviations of the 2012 and 2013 mean site and source EUI for DC buildings are too large to rule out the possibility that such small changes are simply accidental, rather than reflective of any trend.  Scientists would know that.  Politicians would not — nor would they care if it makes or a good sound bite.

Let me now address the other claim.  It may well be true that the median ENERGY STAR score for district buildings is 74.  I cannot confirm this – but I have no reason to doubt its veracity. But there are no data to support the assumption that the median ENERGY STAR score for all commecial buildings is 50.  All evidence suggests that the national median score is substantially higher — in the 60-70 range, depending on the building type.  My recent analysis shows that the science that underpins these ENERGY STAR scores is wanting.  ENERGY STAR scores have little or no quantiative value and certainly DO NOT indicate a building’s energy efficiency ranking with respect to its national peer group — despite the EPA’s claims to the contrary.

The claim that the median score for US buildings is 50 is similar to making the claim that the median college course grade is a “C.”  Imagine your daughter comes home from College and says, “my GPA is 2.8 (C+) which is significantly higher than the (presumed) median grade of 2.0 (C).  You should be very proud of my performance.”  The problem is the actual median college grade is much closer to 3.3 (B+).  Its called grade inflation.  Its gone on for so many years that we all know the median grade is not a “C.”  Until recently ENERGY STAR scores were mostly secret — so the score inflation was not so apparent. But the publication of ENERGY STAR scores for large numbers of buildings as a result of laws such as those passed in Washington DC has removed the cloak — and the inflation is no longer hidden.

ENERGY STAR scores are no more than a “score” in a rating game whose ad hoc rules are set by the EPA in consultation with constituency groups.   It seems to have motivational value, and there is nothing wrong with building owners voluntarily agreeing to play this game.  But like fantasy football, it is not to be confused with the real game.

2013 NYC Benchmarking Raises Questions about EPA’s new Multifamily Housing Model

A few  weeks ago NYC released Energy Benchmarking data for something like 15,000 buildings for 2013.  9500 of these buildings are classified as “Multifamily Housing” — the dominant property type for commercial buildings in NYC. While data from Multifamily Housing buildings were released by NYC last year, none included an ENERGY STAR building rating as the EPA had not yet developed a model for this type of building.

But a few months ago the EPA rolled-out its ENERGY STAR building score for Multifamily Housing.  So this latest benchmarking disclosure from NYC includes ENERGY STAR scores for 876 buildings of this type.  (Apparently the vast majority of NYC’s multifamily buildings did not qualify to receive an ENERGY STAR score — probably because the appropriate parameters were not entered into Portfolio Manager.)  Scores span the full range, some being as low as 1 and others as high as 100.  But are these scores meaningful?

Earlier this year I published a paper summarizing my analysis of the science behind 10 of the EPA’s ENERGY STAR models for conventional building types including: Offices, K-12 Schools, Hotels, Supermarkets, Medical Offices, Residence Halls, Worship Facilities, Senior Care Facilities, Retail Stores, and Warehouses.  What I found was that these scores were nothing more than placebos — numbers issued in a voluntary game invented by the EPA to encourage building managers to pursue energy efficient practices.  The problem with all 10 of these models is that the data on which they are based are simply inadequate for characterizing the parameters that determine building energy consumption.  If this were not enough the EPA compounded the problem by making additional mathematical errors in most of its models.  The entire system is built on a “house of cards.”  The EPA ignores this reality and uses these data to generate a score anyway.  But the scores carry no scientific significance.  ENERGY STAR certification plaques are as useful as “pet rocks.”

Most of the above 10 models I analyzed were based on public data obtained from the EIA’s Commercial Building Energy Consumption Survey (CBECS).  Because these data were publicly available these models could be replicated.  One of the models (Senior Care Facilities) was based on voluntary data gathered by a private trade organization — data that were not publicly available. I was able to obtain these data through a Freedom of Information Act (FOIA) request and, once obtained, confirmed that this model was also not based on good science.

Like the Senior Care Facility model, the EPA’s Multifamily Housing ENERGY STAR model is constructed on private data not open to public scrutiny.  These data were gathered by Fannie Mae.  It is my understanding that a public version of these data will become available in January 2015.  Perhaps then I will be able to replicate the EPA’s model and check its veracity.  Based on information the EPA has released regarding the Multifamily ENERGY STAR model I fully expect to find it has no more scientific content than any of the other building models I have investigated.

One of the problems encountered when building an ENERGY STAR score on data that are “volunteered” is that they are necessarily skewed.  Put more simply, there is no reason to believe that the data submitted voluntarily are representative of the larger building stock.  ENERGY STAR scores are supposed to reflect a building’s energy efficiency percentile ranking as compared with similar buildings, nationally.  When properly defined, one expects these scores to be uniformly distributed in the national building stock.  In other words, if you were to calculate ENERGY STAR scores for thousands of Multifamily Housing Buildings across  the nation, you expect 10% of them to be in the top 10% (i.e., scores 91-100), 10% in the lowest 10% (i.e., scores 1-10), and so on.  If this is not the case then clearly the scores do not mean what we are told they mean.

Meanwhile, it is interesting to look at the distribution of ENERGY STAR scores that were issued for the 900-or-so Multifamily Housing facilities in NYC’s 2013 benchmarking data.  A histogram of these scores is shown below.  The dashed line shows the expected result — a uniform distribution of ENERGY STAR scores.  Instead we see that NYC has far more low and high scores than expected, and relatively fewer scores in the mid-range.  24% of NYC buildings have ENERGY STAR scores ranging from 91-100, more than twice the expected number.  And 31% of its buildings have scores 1-10, more than 3X the expected number.  Meanwhile only 12% have scores ranging from 41 to 90.  We expect 50% of the buildings to have scores in this range.

histogram of 2013 MFH NYC ES scores

Of course it is possible that New York City just doesn’t have many “average” Multifamily Housing buildings.  After all, this is a city of extremes — maybe it has lots of bad buildings and lots of great buildings but relatively few just so-so buildings.  Maybe all the “so-so” buildings are found in the “fly-over states.”

I ascribe to the scientific principal known as Occam’s Razor.  This principal basically says that when faced with several competing explanations for the same phenomenon, choose the simplest explanation rather than more complicated ones.  The simplest explanation for the above histogram is that these ENERGY STAR scores do not, in fact, represent national percentile rankings at all.  The EPA did not have a nationally representative sample of Multifamily Housing buildings on which to build its model, and its attempt to compensate for this failed.  Until the EPA provides evidence to the contrary — this is the simplest explanation.