Last week I posted a graph of the Cottage daily electric use. This graph is updated every day. While the graph is very useful, it does not include any propane used. While there are many days that the cottage does not use propane, I do expect to use propane for heat this winter. And there were some days in November when propane was used to heat the cottage.
As I suggested earlier, propane and electric use can be included on a single graph of daily energy cost. Electric energy costs me $0.30/kWh in Maine and propane costs $4.29/gal. (I should point out that propane cost would be significantly lower if I used much more propane. My local supplier is currently charging $3.30 per gallon delivered for customers with 1000 gal annual use. So far my use is at the 100-200 gal/year level.)
This month (December) I am using propane heat much more in order to actually compare my propane flow numbers with the amount of propane that is delivered. I received a propane delivery about a week ago, so my goal is to use a significant amount of propane in the next few weeks so that I can use the next propane delivery to calibrate my propane flow meter.
I have performed a preliminary calibration of the propane flow meter — and that calibration is being used to produce the propane costs in the above graph. But I do expect to adjust these figures once I receive the next propane delivery.
Recall from my earlier post that, under conditions that my heat pump had a heating COP = 3.3, propane heat cost was about 2.2X the cost of heat from my heat pumps. So it is with great reluctance that I turn off the heat pumps and heat with propane. Such is the cost of scientific experiments.
I figure it would be too boring for me to post detail after detail about my Home Assistant (HA) automation system implemented in Maine. Instead I will share some things we have learned using the system, and along the way provide some details relevant to the particular post.
Today’s post is to share energy-use data I have gathered on three generations of refrigerators, purchased in 1985, 2006, and 2022.
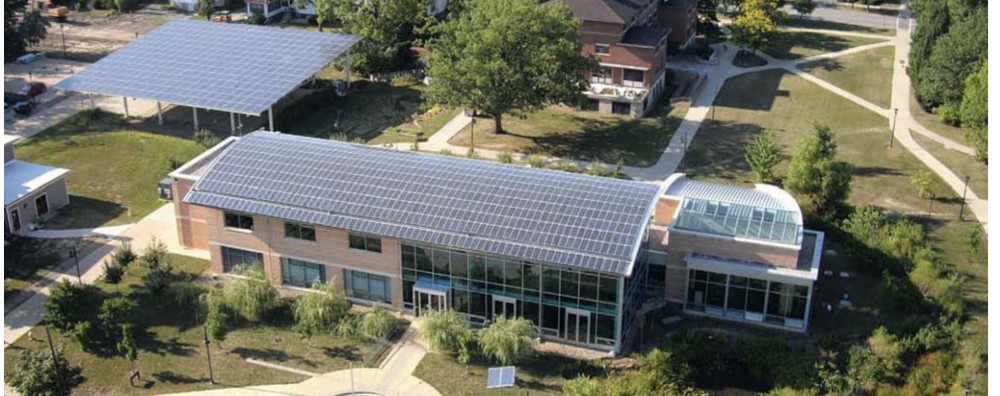
As mentioned in my last post, 2 years ago we began construction of a guest house at our property in Maine. Last summer we began using the guest house and installed in it a new, LG 20 cubic foot refrigerator with ice maker. We bought the refrigerator from our local Home Depot.
We purchased our Maine property in 2000. The property included a 3-bedroom ranch-style house and a saltwater dock. On the dock was a small 12′ x 24′ fish house. Both structures had refrigerators. In 2006 we purchased a new, Admiral refrigerator for the main house. The refrigerator in the fish house was a GE model, presumably new in 1985.
So, this summer I find myself using three refrigerators, one (LG in the cottage) purchased in 2022, a second (Admiral in the house) purchased in 2006, and the third (GE in the fish house), presumably purchased in 1985. Being a scientist, I just couldn’t resist measuring and comparing their daily electric use.
My HA instance records data from a variety of smart sensors. A device I have found particularly useful and reliable is the Sonoff S31 smart plug which costs about $10. These outlets communicate via WiFi and allow one to use a phone app to turn them on and off, and also provide real-time data on the electric power being used. They are also compatible with Home Assistant.
Being especially nerdy I decided to re-configure the plugs by installing Tasmota firmware on them. I purchased an inexpensive device to accomplish this with a laptop and usb port. My Oberlin colleague and friend Bill Mohler made me a jig to connect this to the ESP8266 boards (inside the S31 smart plugs) without soldering wires. About a month ago I installed the Tasmota firmware on 12 of these devices. (I watched several YouTube videos to figure out this process.) Each of my three refrigerators were plugged into their own S31/Tasmota smart plugs and I recorded their daily electric use with HA.
The results, while not unexpected, are rather dramatic . They are shown in the graph below.
Before June 13 the oldest refrigerator used about 4 kWh/day while the newest refrigerator used 0.73 kWh/day. We currently pay about $0.25/kWh for electricity in Maine. The difference in energy costs for the two refrigerators is $0.81/day. This corresponds to $300/year in excess electric costs (for a 365-day year) for the oldest fridge — as compared with the newest!
With literally 1 week of monitoring it was clear that we needed to replace the dock fridge with a newer one. (Mind you, I have been using this refrigerator for 23 summers.) On June 13, for a cost of $680, Home Depot delivered a 20-cu ft LG fridge and hauled away the old GE fridge. The energy savings is obvious.
We actually use the dock fridge only 5 months of the year, so the annual payback is (5/12)*$300 = or $123/year. The simple payback time is 5.5 years.
And, of course, there are other positive returns. The old GE fridge had broken shelves and did not look so nice. The newer LG model is cleaner and nicer.
Then there is the carbon savings. EPA’s e-grid says that the carbon content for Maine’s region of the electric grid (NEWE) is 0.54 lbs CO2/kWh. The annual savings (based on 5 mos use) of 500 kWh represents an annual reduction of 270 lbs of CO2 emission. The savings would be greater in many regions of the country where the carbon footprint of the grid is larger.
And yes, I should have replaced the house refrigerator (used year round) with the new LG, and moved the Admiral to the fish house. The prospect of emptying the fridge and moving it was just too much that day. Maybe next summer I will find the energy to do that.
Bottom line — this upgrade is a no-brainer. My $680 investment in a new refrigerator has a higher rate of return than anything in my retirement portfolio or bank accounts.
Of course, this is not news. Numerous organizations like Efficiency Maine are working diligently to promote efficiency upgrades.
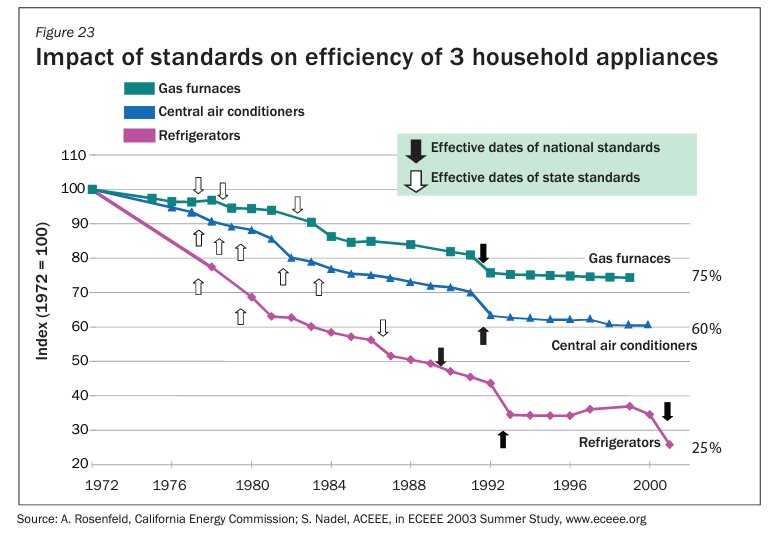
25 years ago David Goldstein of the NRDC came to speak to my Oberlin College class on Energy Science and Technology to tell us how voluntary efficiency standards negotiated with appliance manufacturers had steadily produced more and more efficient appliances. This trend is captured in a graph published in the 2008 APS Efficiency study report of which David Goldstein was a coauthor.
So, I have not made a new discovery. Still, it is useful to be reminded that a little investment now can yield tremendous savings when it comes to energy efficiency.