
The EPA regularly puts out press releases claiming the amount of energy that has been saved nationally by its Energy Star program. In its October 2012 Data Trends publication entitled “Benchmarking and Energy Savings” the EPA writes the following:
Do buildings that consistently benchmark energy performance save energy? The answer is yes, based on the large number of buildings using the U.S. Environmental Protection Agency’s (EPA’s) ENERGY STAR Portfolio Manager to track and manage energy use.
After making this claim the EPA offers the following supporting evidence.
Over 35,000 buildings entered complete energy data in Portfolio Manager and received ENERGY STAR scores for 2008 through 2011, which represents three years of change from a 2008 baseline. These buildings realized savings every year, as measured by average weather-normalized energy use intensity and the ENERGY STAR score, which accounts for business activity. Their average annual savings is 2.4%, with a total savings of 7.0% and score increase of 6 points over the period of analysis.
What does this mean? Does this mean that every one of the 35,000 buildings in question saw energy savings? Impossible – over time some buildings saw their energy use go up and others saw it go down. The statement clearly refers to an average result. But what is being averaged? The EPA is referring to the average (weather normalized) source energy intensity (EUI) for these 35,000 buildings — saying that it has decreased by 7% over three years In addition it points out that the average Energy Star score for these buildings has increased by 6 points over three years. The graphs below summarize these trends.
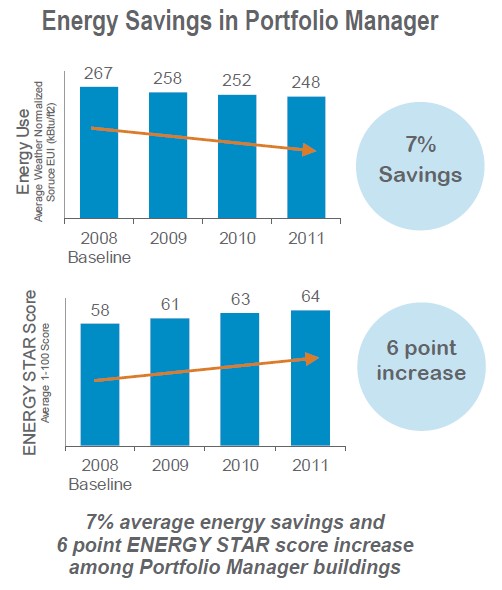
So here is the problem. The average EUI for a set of N buildings has nothing to do with the total energy used by these buildings. The average EUI could go down while the total energy use goes up and vise versa. Some buildings see their EUI go up – and these buildings use more energy – and some see their EUI go down – and these buildings use less energy. But you cannot determine whether more or less energy is used in total without calculating the actual energy saved or lost by each building – and this requires that you know more than the energy intensity (EUI) — you must also factor in each building’s size or gsf. This set of 35,000 buildings includes buildings that are 5,000 sf in size and others that are 2,000,000 sf in size – a factor of 400 larger. The EPA calculates mean EUI by treating every building equally. But each building does not contribute equally to the total energy – bigger buildings use more energy. (The EPA has employed the methodology used by the New Buildings Institute in their, now discredited, 2008 study of LEED buildings.)
It may be that these 35,000 buildings, in total, save energy. But we don’t know and the EPA has offered no evidence to show that they do. Moreover, I have asked the EPA to supply this evidence and they refuse to do so. It is an easy calculation – but they choose not to share the result. You can bet they have performed this calculation – why do you suppose they don’t share the result?
Now turn to the increased average Energy Star score. There is actually no connection whatsoever between the average Energy Star score for a set of buildings and their total energy use. For a single building, its Energy Star score, combined with its measured EUI and gsf allows you to calculate the energy it saved as compared with its predicted energy use. Readers might be surprised to learn that a building’s Energy Star score can go up while its energy use rises as well.
But for a collection of buildings no such relationship exists. If they are all one type of building (for instance, all dormitories) you can combine their individual scores with their individual gsf and their individual EUI to learn something about their total energy – but absent this additional information it is hopeless. And if the buildings are from more than one building type there is absolutely no meaning to their average Energy Star Score. Such statistics are intended only to impress the ignorant.
The EPA, therefore, has presented no evidence to support the claim that buildings that are regularly scored in Portfolio Manager collectively save energy. Instead they have offered meaningless sound bites — claims that sound good but have no scientific relevance.
It is easy to see the problem by considering a simple case — two buildings – one a 100,000 sf office building and the other a 10,000 sf medical office. Suppose in year 1 the office building has an EUI of 100 kBtu/sf and an Energy Star Score of 60, while in year 2 it has an EUI of 120 kBtu/sf and an Energy Star Score of 58. Suppose that the medical office building in year 1 has an EUI and Energy Star score of 140 kBtu/sf and 50, respectively, and in the year 2 an EUI of 120 kBtu/sf and an Energy Star score of 60.
In this simple example the “average EUI” for year 1 is 120 kBtu/sf and for year two is 110 kBtu/sf – by the EPA’s standards, an 8% energy savings. But when you work out the numbers you find their combined energy use in year two actually rose by 14%. Surely EPA officials understand the difference.
To summarize, the EPA has claimed that the energy consumption of buildings that regularly use portfolio manager has gone down by 2.4% per year but they have offered no evidence to support this – only evidence that the average EUI for these 35,000 buildings – a meaningless figure, has gone down.
The EPA should either withdraw their claim or provide the evidence to back it up.

Pingback: ENERGY STAR energy benchmarking is not ready for prime time | The Pragmatic Steward