Unknown's avatar

About The Pragmatic Steward

Professor of Physics at Oberlin College. I was originally trained as a condensed matter experimentalist. In the last 15 years my research has focused on photovoltaic devices, PV arrays, wind energy, energy efficiency, and energy use in buildings.

Excessive Heat Pump Energy – Update

A few weeks ago in my post I described how one of my four Mitsubishi mini-split heat pumps was using excessive energy. Today’s post provides additional information about that. Apparently the excessive energy is by design! For background please revisit my August 12 post.

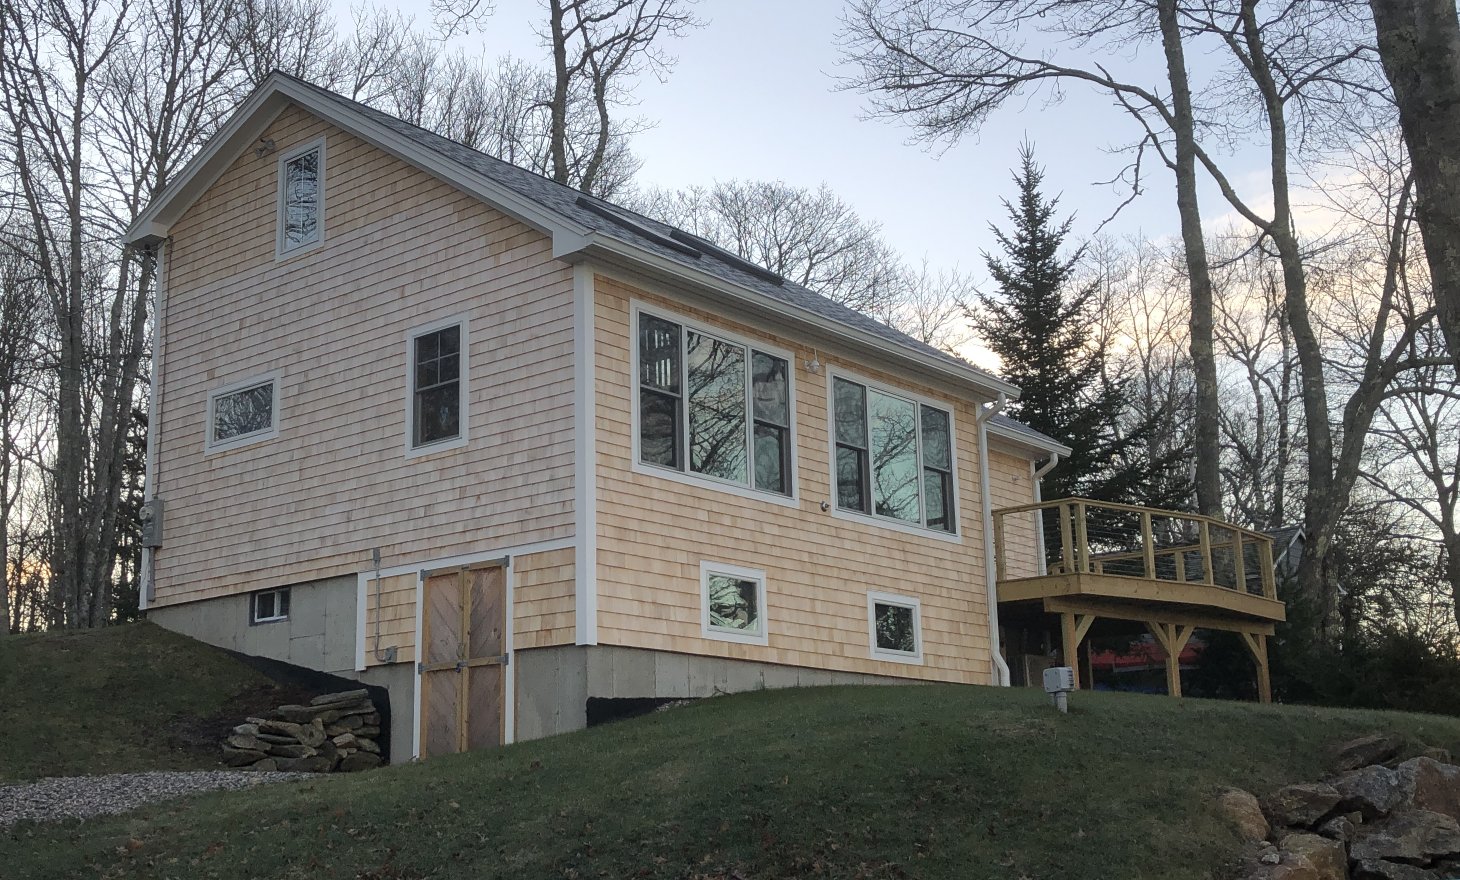
Just a quick recap — In the last three years I have had four, low-temperature, mini-split heat pumps installed on my property in Maine. The oldest of these is a 15 kBtu/h unit that is installed in my house living room. The model number for its outdoor unit is MUZ-FH15NA. The other three units were installed over the next two years. Their outdoor units have model numbers: MUZ-FS06NA, MUZ-FS18NA, and MUZ-FS06NA. (Apparently the “FS” models are improved over the “FH” models.) All four compressors use R410A refrigerant.

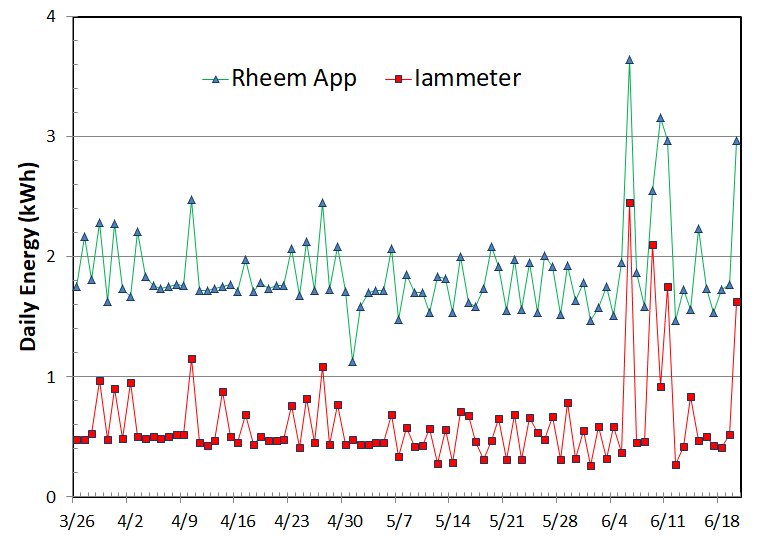
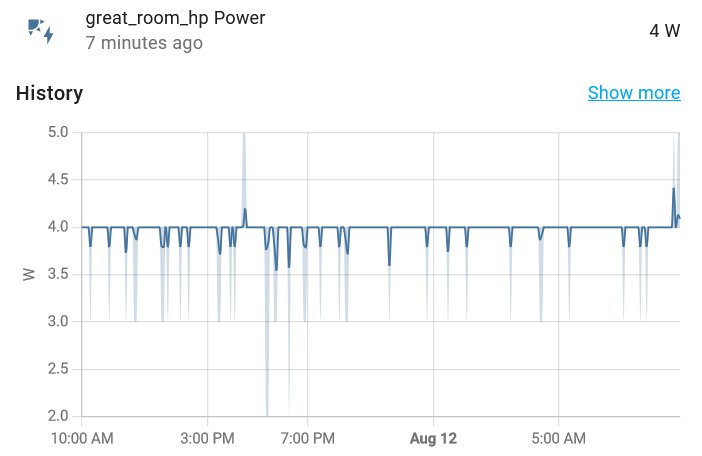
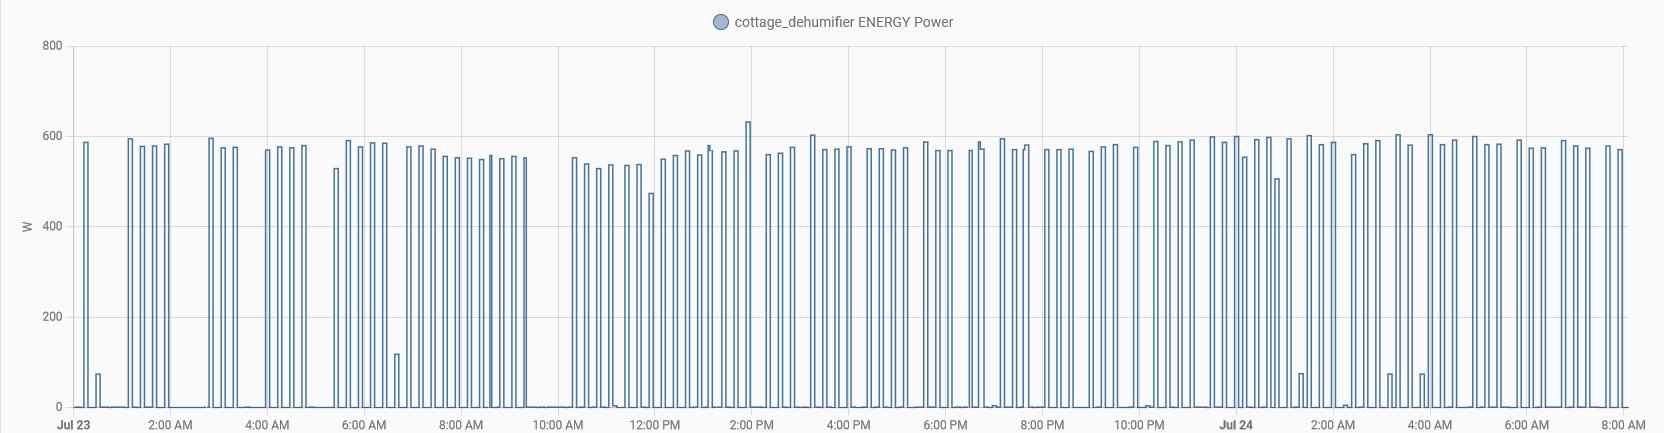
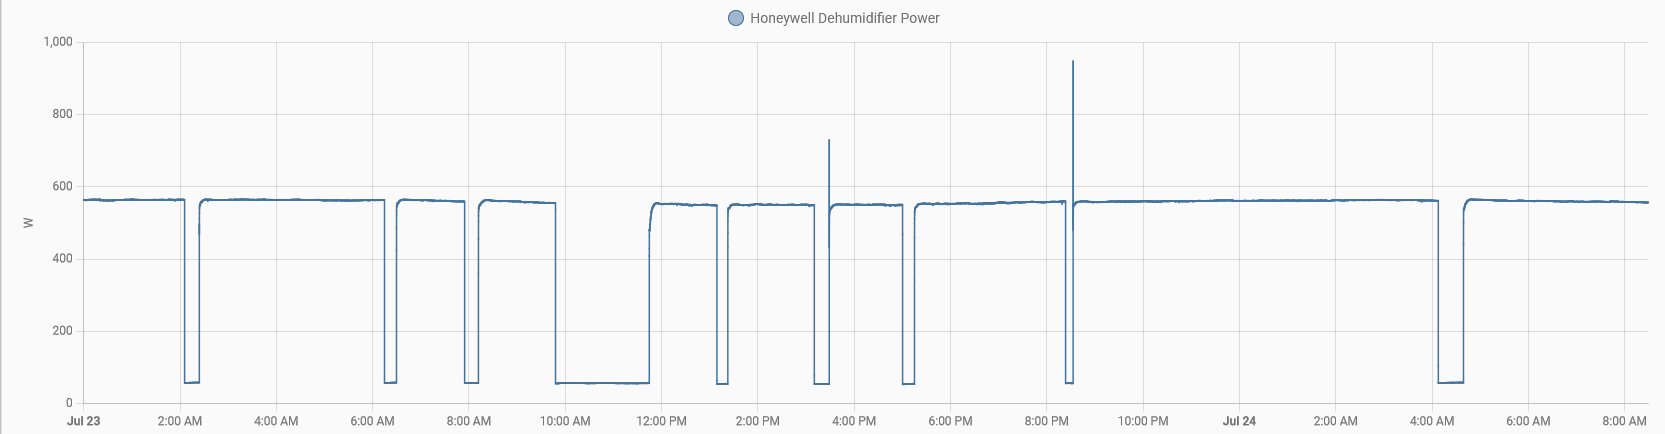
These units have seen minimal use since the beginning of May. On rare occasions we have used them for a bit of cooling or heating. They have simply remained in standby mode for nearly 120 days. Three of these use 3-4 W of continuous standby power but the oldest, the 15 kBtu/h unit, particularly during the night, experiences 70W power spikes every two hours or so that last for about 10 minutes. This causes this unit to use about 0.2 kWh per day more energy than the other three. For three months I have been seeking to understand what is going on.

Back in June I emailed my installer, Dave’s Appliance, questions about this performance including graphs and other details. I have always found Dave’s to be extremely helpful. They could not explain what was going on so they passed the information along to their Mitsubishi support team. A couple of months went by with no answer.

I pestered them some more. Finally, in mid-August, two technicians from Dave’s drove the 50 miles from Winthrop to my house to make measurements on the compressor while on the phone with their Portland Mitsubishi tech support. With the travel time, these guys spent a half day addressing my issue. The only measurements they made were to confirm that a certain thermistor had the correct value.

One of the techs who came to my house was Ean Laflin, the heat pump service manager with Dave’s Appliance. After he was done troubleshooting and speaking with Mitsubishi he explained that there was a 70 W heater in the compressor, and that the control board turned it on whenever the ambient temperature was below 68F. Presumably after the heater ran for 10 minutes the temperature of the thermistor rose above the set point causing the heater to turn off. (It is my impression that there is oil in this compressor, and this heater is intended to keep the viscosity of this oil low so the compressor will start easily when called upon.)

But this begs the question, why would this heater be activated when the ambient temperature ranges from 60F to 68F? I could see the need to heat the oil during the winter. But in my part of Maine from May – October the ambient temperature is usually above 68F for much of the day and usually drops below 68F late at night. For nearly four months I have not needed this heat pump yet the heater keeps using energy, night after night. The only way I can avoid this is to shut off the circuit breaker. This is obsurd!

So why doesn’t this same thing happen with my other three heat pumps? Ean tells me that the control board on these slightly newer models is shipped with a jumper that can be set so as to disable this feature — apparently this is the default setting. He can change the jumpers on the other three heat pumps so that all four of my heat pumps run this heater and waste energy. But there is no jumper to change on my Living Room heat pump to reduce its standby power to 3W like the other three heat pumps.

I conclude from this that Mitsubishi, after shipping thousands or perhaps millions of heat pumps with this control strategy determined it was not necessary and “improved” the next generation of control boards. The only way to “improve” my heat pump would be to install a new control board. I recognize this is not a cost effective way to save the $15/year wasted by this heater.

Which leads me to my last point. Each one of my four heat pumps is connected to the internet and can be controlled using the Kumo Cloud App. Why can’t Mitsubishi download updated firmware over the internet to fix this bug? Hundreds of millions of devices (phones, etc.) that only cost a few hundred dollars can receive updated firmware over the internet. Why can’t Mitsubishi figure this out for heat pumps that cost many thousands of dollars? The technology really needs to be updated.

Initial Assessment of Rheem Hybrid heat pump hot water heater

In my Maine Guest Cottage I have installed a 50 gallon, Rheem hybrid heat pump hot water heater. I purchased this unit at Home Depot about 16 months ago. The price was roughly $1600 with a large $800 rebate from Efficiency Maine. My cost then was only about $800. My other option was an electric hot water heater which would have cost me about $600 and did not come with a rebate.

There were cheaper heat pump hot water heaters available at the time but I was enamored by the WiFi interface that came with the Rheem unit. This, along with the Rheem Econet smart phone App, would allow me to remotely change the unit’s settings and also monitor its daily (even hourly) electric use.

The energy guide for this unit suggested that it would cost $104 per year to operate, based on an estimated annual electric us of 866 kWh and an electric price of $0.12/kWh. Here in Maine I pay about $0.30 per kWh for electricity.

I installed the Rheem unit in my unheated cottage crawl space. Most of our hot water use will be in the summer when we actually have guests staying there. Heat pump operation during that period should help dehumidify the crawl space. In the winter months when we do not use much hot water I will likely have to switch the unit to resistive electric mode as the crawl space will be cold and any heat removed from the crawl space air would have to be made up by some other heating system.

This coming winter I intend to make detailed measurements to understand the energy performance of this unit. But already some information has emerged.

The first issue is the inaccuracy of the energy use reported by the Rheem Econet App. For my first six months of operation this was my only measure of energy use for the hot water heater. According to the App the unit was averaging 2.0 kWh/day. For most of this time no one was living in the cottage so that hot water use was minimal. This daily energy corresponds to an annual use of 730 kWh per year — using essentially no hot water use! (That is, this is the energy loss from the 50 gallon tank.) Imagine what the energy use would be if a family of four was using hot water for showers, laundry, and such. I suspected the energy consumption data were inaccurate.

So, I connected up a single-phase iammeter energy monitor to this 220VAC circuit to measure energy use of the Rheem unit. I found that the Rheem unit used significantly less energy than its app reported. The graph below compares the daily electric use as measured by the Rheem Econet App to that independently measured with my iammeter energy monitor for a three month period.

The Rheem Econnet App for this three month period reports an average energy use of 1.88 kWh/day while the iammeter measured 0.62 kWh/day. The Rheem’s own measurements while highly inaccurate, are correlated to the actual energy use. The graph below demonstrates this correlation. The R-square for this fit is 88%.

I do not understand why Rheem has not provided accurate power measurement on their $1600 hot water heater when numerous companies are selling smart plugs with accurate power measurement for $10.

The second problem I have with the Rheem App is that it seems to have a mind of its own. There were times this last year when I wanted to compare the energy use in electric resistive heat mode to that used in heat pump mode. Accordingly I would use the App to set the mode to resistive heat. A few days later, without warning, I would discover that the unit had returned to heat pump mode though I had not made this change. This is something I will investigate further this coming year.

The third problem I found was that the temperature of the water provided appears to be significantly lower than that displayed on the app or on the unit’s LCD display.

Before our first guests arrived this summer I thought I should make sure we had adequate hot water. The Rheem water temperature was set to 120F and it was in heat pump mode. I took a shower. With the shower mixing valve set to maximum hot the shower was comfortable for me. Admittedly, I like hot showers. This caused me to worry that the hot water would not be sufficient for 2-3 consecutive showers. Accordingly I raised the Rheem set temperature to 130F. But I began to doubt that the water leaving the Rheem tank was at the specified temperature.

So I decided to install a temperature sensor in the hot water supply line from the Rheem hot water tank. This was accomplished with a DS18B20 sensor inserted into a 3/4 in. “T” fitting that I installed on the output water line from the hot water heater. I programmed an ESPHome D1mini board to monitor this sensor and connected it to my Home Assistant system. Initial measurements suggest the actual temperature of the water is 10-15F lower than the 130F set temperature.

The last thing I will mention is the instrumentation that we have added in preparation for our full year of study coming up. In addition to the aforementioned temperature sensor, I have installed two water meters with pulse output, one on the water supply line to the guest cottage and the other on the HW supply line leaving the Rheem HW heater. These meters will allow me to monitor CW and HW use in 1 gallon increments.

The other feature that I installed was a “dump line” from the hot water heater. To study the performance of the hot water heater I will need to regularly use hot water. But no one is living in the cottage through the winter. To address this issue I installed a motorized valve downstream from the HW meter that will allow me to remotely, and under program control, “dump” hot water down the drain. This will, of course, result in wasted energy — but this will be necessary to study the performance of the Rheem under conditions that replicate 2-4 people living in the cottage.

Excessive Energy Use by one of my Mitsubishi Mini-Split Heat Pumps

In the last three years I have had four Mitsubishi low-temperature mini-split heat pumps installed in Maine. Two of these are smaller, 6 kBtu/h units, one is an 18 kBtu/h unit, and the oldest of these is a 15 kBtu/h unit, located in my living room.

I have been monitoring the electric use of the two cottage heat pumps for more than a year. In March 2023 I began monitoring the energy use for the two older heat pumps in the house.

This post looks at the standby power of the four units. One of the units displays, what I would characterize as strange behavior. I have reached out both to Mitsubishi and to Dave’s Appliance who installed my units and no one has explained the behavior. Perhaps someone reading this post will be able to shed light on this.

These days all four of my heat pumps have power but are turned OFF so that they provide neither cooling nor heating. They are essentially in stand-by mode. As mentioned, three of these heat pumps use about 4W of standby power. A graph of P(t) for the last day or so for my 18 kBtu/h unit in the cottage is shown below.

In contrast to the 4W standby power of the above heat pump, the 15 kBtu/h heat pump in my house living room displays the behavior shown below.

The above heat pump has standby power of about 5W during the day, then starting at midnight, has periodic spikes of close to 70W. These bursts last for only about 10-12 minutes, then re-appear about 2 house later. These bursts stop sometime the next morning, then the pattern repeats the following night.

The excessive energy use is not much on a day-to-day basis. My three heat pumps use about 0.11 kWh per day per unit in standby mode. The one with bursts of power uses about 0.23 kWh per day in standby mode. The excessive use is about 44 kWh per year which, at $0.30/kWh, costs about $13 per year. Again, the excessive energy is not that much — but what is its origin? What is it about the control of this heat pump that is different from the other three?

These graphs just illustrate that a lot is going on in these heat pumps that you would not notice if you don’t measure their power use. They all seem to be operating normally, otherwise.

I would welcome any input if anyone can explain the behavior.

For reference, the model numbers for the 15 kBtu/h units that show anomalous behavior are MUZ-FH15NA for the outdoor unit and MSZ–FH15NA for the indoor unit.

All of the heat pumps are 220VAC units. I monitor their electric use with iammeter single-phase units. The data from these units are regularly logged with Home Assistant.

Dehumidifier Energy

The town of Oberlin, OH was essentially built on a swamp. Oberlin basements commonly experience water problems. When we first purchased our Oberlin home in 1988 there were a few storm events that left water puddles in our basement. Various measures eliminated this problem, but high summer humidity remains an issue. For years we have employed a basement dehumidifier to prevent mold and mildew.

Our house in Maine also has humidity issues. We are on the Atlantic coast where the relative humidity is always above 70%. Both our house and guest cottage are built on granite ledge sloping down to the water. I wouldn’t have thought so, but it turns out the granite ledge is relatively porous to water flow. After every rain storm, water flowing down the hill towards the river creates water issues in our crawl spaces. Dehumidifiers have proved to be important to prevent condensation on our water pipes and mildew on the wood.

I have read that you need to keep the relative humidity level in your crawl space below 60% to prevent problems. The usual way to accomplish this is to 1) prevent water from entering the crawl space using water and vapor barriers, and 2) use a dehumidifier to remove what water does enter.

I have three dehumidifiers located in 1) our guest cottage crawl space, 2) house basement/crawl space, and 3) our Oberlin house basement.  All three are plugged into smart plugs that record their energy use. The two Maine units are commercial units from AlorAir and the Oberlin one is a Honeywell residential unit.

In Oberlin I have a heated basement, so the dehumidifier never has to remove water from cold air.  The Honeywell unit can handle that.  I do not run it during the winter. In contrast, the Maine crawl spaces are not heated and get quite cold.  The AlorAir commercial dehumidifiers can remove water even when the air temperature is in the 40’s.  I ran both of them last winter — not sure if I need to and will try to figure that out.

The graph below shows they day-to-day energy use of our guest cottage. As the graph shows, the dehumidifier uses 4-5 kWh of energy daily.

The AlorAir unit uses 600 W when the compressor is running. I normally leave its set point at 60% relative humidity and the compressor cycles on and off. A typical graph of its power vs time is shown below.

When I lower the set point the duty cycle increases (i.e., time that the compressor is on is longer) and the daily energy increases — all as expected.

I am a bit worried about the frequent cycling of the above dehumidifier. I don’t understand why the control doesn’t include a larger “deadband” so that the compressor does not switch on and off so frequently. I attempted to reach out to AlorAir to learn more but I found their technical support to be unresponsive.

The first graph above shows that the dehumidifier used much more energy on July 17. The reason for this is that I decided to try cooling the guest cottage air by circulating it through the crawl space. This exposed a continuous source of humid, warm air to the dehumidifier and it ran nearly continuously. After one day I concluded this was not the optimum way to cool the cottage.

The average energy used by the dehumidifier in my Maine house for July has been 3.4 kWh/day. The area of the house crawl space is larger than that of the cottage, but it is better sealed. Unlike the cottage the crawl space floor in the house is fully sealed with concrete.

The average energy used by the dehumidifier in in Oberlin for July is about 12 kWh per day. Our house there is over 100 years old and all the walls lack modern vapor barriers. The graph below shows the power used by this dehumidifier. This unit removes about 60 pints of water daily and runs almost all the time during the summer.

This dehumidifier is about a year old. My experience with these “basement units” is that they work well for a few years. After a few years they continue to use lots of energy but don’t remove much water. When I bought this Honeywell unit last fall, the dehumidifier it replaced was 4 years old. I ran the two of them side by side for a few days and found the new unit removed water at a rate 5X that of the old one (even though they had the similar specs and were using similar energy). It is hard to throw the old one away because it still removes water — just not good at it.

What I don’t know is the importance of keeping the relative humidity of my Maine crawl spaces low in the winter. My instinct is to believe that mildew and mold won’t grow during the winter in my cold crawl spaces even if the relative humidity is high. But when the temperature warms in the spring I need to keep the humidity level below 60%. But this is just a hypothesis. So far I am erring on the side of caution and running the dehumidifiers year round. They just use less energy in the winter.

I would like to reduce the energy and carbon emission associated with dehumidification. That would be accomplished by raising the relative humidity set point on the dehumidifier. But under no circumstances can I tolerate mold or mildew. I would be interested in learning what people have to say about this issue for cold and warm weather. Is RH% a relevant metric when the air temperature is low as is the case in the winter? Does it make sense to use lots of energy to achieve 60% relative humidity in a crawl space whose temperature is below 45F? I don’t know the answer to these questions and would value informed input.

Get rid of that 30-year old refrigerator

I figure it would be too boring for me to post detail after detail about my Home Assistant (HA) automation system implemented in Maine. Instead I will share some things we have learned using the system, and along the way provide some details relevant to the particular post.

Today’s post is to share energy-use data I have gathered on three generations of refrigerators, purchased in 1985, 2006, and 2022.

As mentioned in my last post, 2 years ago we began construction of a guest house at our property in Maine. Last summer we began using the guest house and installed in it a new, LG 20 cubic foot refrigerator with ice maker. We bought the refrigerator from our local Home Depot.

We purchased our Maine property in 2000. The property included a 3-bedroom ranch-style house and a saltwater dock. On the dock was a small 12′ x 24′ fish house. Both structures had refrigerators. In 2006 we purchased a new, Admiral refrigerator for the main house. The refrigerator in the fish house was a GE model, presumably new in 1985.

So, this summer I find myself using three refrigerators, one (LG in the cottage) purchased in 2022, a second (Admiral in the house) purchased in 2006, and the third (GE in the fish house), presumably purchased in 1985. Being a scientist, I just couldn’t resist measuring and comparing their daily electric use.

My HA instance records data from a variety of smart sensors. A device I have found particularly useful and reliable is the Sonoff S31 smart plug which costs about $10. These outlets communicate via WiFi and allow one to use a phone app to turn them on and off, and also provide real-time data on the electric power being used. They are also compatible with Home Assistant.

Being especially nerdy I decided to re-configure the plugs by installing Tasmota firmware on them. I purchased an inexpensive device to accomplish this with a laptop and usb port. My Oberlin colleague and friend Bill Mohler made me a jig to connect this to the ESP8266 boards (inside the S31 smart plugs) without soldering wires. About a month ago I installed the Tasmota firmware on 12 of these devices. (I watched several YouTube videos to figure out this process.) Each of my three refrigerators were plugged into their own S31/Tasmota smart plugs and I recorded their daily electric use with HA.

The results, while not unexpected, are rather dramatic . They are shown in the graph below.

Before June 13 the oldest refrigerator used about 4 kWh/day while the newest refrigerator used 0.73 kWh/day. We currently pay about $0.25/kWh for electricity in Maine. The difference in energy costs for the two refrigerators is $0.81/day. This corresponds to $300/year in excess electric costs (for a 365-day year) for the oldest fridge — as compared with the newest!

With literally 1 week of monitoring it was clear that we needed to replace the dock fridge with a newer one. (Mind you, I have been using this refrigerator for 23 summers.) On June 13, for a cost of $680, Home Depot delivered a 20-cu ft LG fridge and hauled away the old GE fridge. The energy savings is obvious.

We actually use the dock fridge only 5 months of the year, so the annual payback is (5/12)*$300 = or $123/year. The simple payback time is 5.5 years.

And, of course, there are other positive returns. The old GE fridge had broken shelves and did not look so nice. The newer LG model is cleaner and nicer.

Then there is the carbon savings. EPA’s e-grid says that the carbon content for Maine’s region of the electric grid (NEWE) is 0.54 lbs CO2/kWh. The annual savings (based on 5 mos use) of 500 kWh represents an annual reduction of 270 lbs of CO2 emission. The savings would be greater in many regions of the country where the carbon footprint of the grid is larger.

And yes, I should have replaced the house refrigerator (used year round) with the new LG, and moved the Admiral to the fish house. The prospect of emptying the fridge and moving it was just too much that day. Maybe next summer I will find the energy to do that.

Bottom line — this upgrade is a no-brainer. My $680 investment in a new refrigerator has a higher rate of return than anything in my retirement portfolio or bank accounts.

Of course, this is not news. Numerous organizations like Efficiency Maine are working diligently to promote efficiency upgrades.

25 years ago David Goldstein of the NRDC came to speak to my Oberlin College class on Energy Science and Technology to tell us how voluntary efficiency standards negotiated with appliance manufacturers had steadily produced more and more efficient appliances. This trend is captured in a graph published in the 2008 APS Efficiency study report of which David Goldstein was a coauthor.

So, I have not made a new discovery. Still, it is useful to be reminded that a little investment now can yield tremendous savings when it comes to energy efficiency.

Mini-split Heat Pumps and Heat Pump HW Heater

I think it has been two years since I have posted on this blog. This post is the beginning of a new direction for me.

A couple of years ago my wife and I built a small guest cottage on our property in Maine. Mostly we will use this in the summers, but we decided to go ahead and make it a year-round house. I also decided to make it a laboratory for understanding the performance of a couple of heat pump technologies.

The house is outfitted both with a Rinnai direct vent propane furnace as well as two Mitsubishi, low-temperature, mini-spit heat pumps. We were going to use an electric hot water heater but, instead, decided to install a Rheem hybrid heat-pump hot water heater. Heat pump hot water heaters offer the potential for considerable energy savings in the summer, but savings in the winter are less obvious. I am anxious to study this.

For the next year I intend to report on my findings for this guest cotttage. I have some systematic experiments planned to answer questions such as:

  • what is the efficiency (or heating COP) for these heat pumps at different outside temperatures
  • how does the cost of heating with propane compare to those using electric heat pumps
  • how does the carbon footprint compare between propane and heat pumps
  • do night time setbacks produce energy savings with heat pumps as they do with propane
  • how does the energy use of my heat pump hot water heater compare with an electric hot water heater
  • what is the impact of the heat pump hot water heater on my winter heating costs

I hope to yield definitive answers to some of the above questions. No doubt other questions will come up along the way.

I am primarily interested in the winter performance of these systems.

During the summer we will have guests using the cottage and that will make it difficult to control various parameters. During the winter my wife will be using the cottage during the day as her office. In the evenings it will be unoccupied — which leaves me excellent opportunity to control the environment. Both day and night the indoor temperature will be closely controlled and documented.

To record data and to control parameters we are running Home Assistant (HA) on a Rasberry Pi 4. All of the relevant devices in the cottage communicate with HA. This allows me to both read and control the heat pumps, hot water heater, propane heater, various temperature and humidity sensors, lights, dehumidifier, electric heaters, etc. Iammeter energy monitors have been installed on the main electric panel and both heat pumps. These communicate with HA, as well. There is also a weather station about 100 ft away from the cottage connected to Weather Underground.

Our main house also contains two Mitsubishi mini-split heat pumps. These, too, along with iammeter power meters attached to each, are monitored with HA.

While a lot of the instrumentation was being developed and installed this last year, we do have some preliminary results worth sharing. These will be the subject of upcoming posts.

Energy and GHG emissions savings for U.S. LEED-certified Office buildings

We have completed the largest peer-reviewed study of measured whole building energy use for LEED-certified commercial buildings ever published. Our paper, “Energy and Greenhouse Gas Savings for LEED-Certified U.S. Office Buildings” can be downloaded from the web site of the open access journal Energies. The abstract is found here.

Our study is based on public municipal building energy benchmarking data from 10 US cities for the year 2016. The entire dataset contains annual energy use and energy-related greenhouse gas emission for over 28,000 properties, of which about 4500 are classified as office. By cross-referencing the benchmarking data with the USGBC LEED Project Database we were able to identify 551 office buildings that were certified in LEED systems that address whole building energy use. These systems were LEED for New Construction (NC), Core & Shell (CS), and Existing Buildings (EB). We have compared the 2016 site energy, source energy, electric energy, non-electric energy and greenhouse gas (GHG) emission of these LEED-certified offices other offices in the same cities in order to understand energy savings associated with LEED certification.

In this post I will talk about the site energy savings observed for LEED offices.

LEED offices in every city were found to use less energy on-site than non-LEED offices, adjusting for size, of course. Except for Washington DC, however, the variability in LEED performance was so large that these savings were not statistically-significant at the usual, 95% confidence level. In aggregate, however, the savings were statistically significant. The results are shown in the figure below.


The red symbols indicate savings in site EUI by LEED office buildings relative to other office buildings in the same city. The error bars represent the 1-sigma standard errors in these savings. In aggregate (ALL CITIES) and in Washington DC the savings are two standard deviations or more above zero. In other cities the savings have larger error. In aggregate the LEED site energy savings is 8.5 kBtu/sf, which represents an 11% savings relative to the site EUI for non-LEED offices. These results are consistent with those we have reported earlier based on 2015 data for Chicago.

It should be noted that these savings are substantially lower than the 30-35% energy savings frequently asserted for LEED buildings – but are nonetheless positive and significant.

I will discuss savings in other metrics in upcoming posts.


Energy Star Scores for LEED EBOM Offices

This is my first post in over a year. As with most of us, covid-19 has changed my priorities.

For some time now I have been studying the energy performance of LEED buildings using Municipal building energy benchmarking data.  I have also investigated the science that underpins the EPA’s building Energy Star score.  In our most recent study, these two issues intersect.

We have completed the largest study of measured energy performance of LEED-certified buildings.  The sources of our data are publicly-reported building energy data from ten cities: Boston, Chicago, Denver, Los Angeles, Minneapolis, NYC, Philadelphia, Portland, Seattle, and Washington DC.  In total we have 2016 energy data from 28,480 properties (buildings or groups of buildings) in these 10 cities.  In these data we have identified about 850 LEED-certified commercial buildings.  This has allowed us to compare the 2016 energy use of LEED buildings with those of similar buildings in the same city for the same year.

Here I want to talk about just one aspect of this study – the 2016 Energy Star scores for offices that were certified under LEED EB:OM (Existing Buildings: Operation & Maintenance).  Offices certified under a LEED EB:OM system are awarded LEED points for energy optimization based on the Energy Star score they earn during a year of operation.  This score (EAc1) can be found for many of these buildings on the Green Building Information Gateway web site.  And this score can be used to determine the Energy Star score that was reported to the USGBC used to earn this score.

Now if a building earned an Energy Star score of 85 at the time of LEED certification, you would expect it to continue earning a similar high score for subsequent years of operation.  We have compared this “Design Energy Star score” (i.e., the score that was used in awarding EAc1 points) with the Energy Star score reported in 2016 municipal benchmarking data for nearly 450 LEED certified offices in these 10 cities.  The graph below shows this comparison.  The color code indicates the LEED system used for certification.

The graph shows there is surprisingly little correlation between these two Energy Star scores.  The purple dashed line represents y = x, the expected result if the 2016 Energy Star score earned by the building is the same as that submitted for certification.  The solid black line is the actual trend line obtained by fitting a straight line to the data.

What we see is that only 19% of the variation in 2016 Energy Star scores is “explained” by the score submitted at time of certification.  81% of the variations in 2016 Scores is unrelated to this initial score.  The pink rectangle shows the range of 2016 Energy Star scores for offices that earned a score of 85 at time of certification.  There are 35 such buildings, and their 2016 Energy Star scores range from 60 to 99.  You see similar variation everywhere along the curve.  In the most outrageous cases a building’s Energy Star score in 2016 was 52 points lower than what was reported when it was LEED certified!

It is very doubtful that these changes in Energy Star score reflect real changes in the energy consumption and operation of these offices.  A much more likely explanation is that the operating parameters reported in securing these scores have changed – not reflecting real changes in computer density, or worker density, or operating hours, but just arbitrary changes due to the fact that a different person (with different motivations) reported these numbers in 2016 from the person who reported them at time of certification. The data illustrate the arbitrary nature of the Energy Star score and the ability to significantly change the score by just submitting different operating parameters.  There is no regulation of these submittals – you can change the number of computers in the building from 4000 to 8000 and there is no one who will question the number.  And this will dramatically change your Energy Star score.

In the past the EPA’s Group that works on Energy Star scores has had exclusive access to the data they gather. But with cities publishing these scores we now have the ability to check them and to see their patterns. The mean and median Energy Star score for the 4200+ offices in the benchmarking data are 74 and 80, respectively.  The EPA claims that the median Energy Star score is 50.  This is nonsense.  These 4200+ offices constitute a sizable fraction of the U.S. office space.  Like the children of Garrison Keillor’s mythical Lake Wobegon, all urban buildings are above average.

EPA Energy Star Review Report Fails to Account for Uncertainties

The other day a friend emailed me a link to the EPA’s April 2019 report of its Review of the Energy Star Hotel benchmarking score.  In a nutshell, after suspending Energy Star Certification for the last six months or so pending a review of its revised methodology, the EPA has issued a report saying their revised methodology is correct and they are resuming operations.  But the statistics reported in this “Analysis and Key Findings” simply confirms what I have documented earlier in my book, that the Energy Star staff do not understand the difference between real trends and random noise.

On page 1 of their report the EPA Energy Star folks publish this table demonstrating how U.S. Lodging buildings have evolved between 2003 and 2012.

The EPA’s text accompanying this table says, “Between 2003 and 2012, the estimated number of hotel buildings in the United States increased by 14%. During that period, the average site EUI decreased by 3% while the source EUI increased by 7%.”

Presumably these statements are made in order to justify changes in Energy Star scores for Hotels/Motels — the building stock has changed so the relative ranking of a particular building with respect to this building stock will change.  Unfortunately the two EPA claims are false.

The table they used to justify this statement is not for Hotels — it is for all buildings classified by CBECS as Lodging.  This includes hotels, motels, inns, dormitories, fraternities, sororities, nursing home or assisted living, and “other lodging.”  Moreover, when you include the EIA’s relative standard errors (RSE) for both the 2003 and 2012 statistics you find these differences are absolutely meaningless.  In particular, the Site EUI figures for 2003 and 2012 in the above tables are uncertain by 17% (2003) and 8% (2012), respectively.  The differences between the 2003 and 2012 SiteEUI are just as likely to be due to random sampling errors as they are real trends!

The EPA’s Hotel Energy Star model applies only to Hotels and Motels/Inns.  When you look at these CBECS data for 2003 and 2012 you find even larger RSE that swamp any differences.  The relevant statistics are shown in the Table below.  The EIA did not calculate statistics for these two categories in 2003; these numbers are calculated by me using CBECS 2003 microdata.  The EIA did perform the calculations for these categories in 2012.  SourceEUI figures are calculated by me using the EPA’s 2012 site-to-source energy conversion figures (3.14 for electric).  The percentages listed are the RSE’s for each statistic.

The number of Hotels increased by 50% from 2003 to 2012.  During this same time the number or motels/inns decreased by 23%; their combined number showed no significant change and their combined floor area increased by 8%, hardly resolvable given the uncertainties in these quantities.  The Site and Source EUI for these two types of facilities did not change in any significant way.  The uncertainties in the survey far exceed the small changes in these EUI.  It is impossible to know whether the changes reflect real trends or just sampling errors.

Joelle Michaels, who oversees the CBECS operation, is well aware of the limitations of the CBECS methodology.  It must drive her nuts to see the Energy Star staff present such silly numbers and reports based on CBECS data.

This gets at the heart of my criticism in my book, Building Energy Star scores: good idea, bad science.  The numbers employed by the EPA in their statistical analysis are so uncertain that in most cases they are studying noise and reading into it things that cannot be found.  The science is sophomoric.  It is the result of teaching a little statistics to people who lack the mathematical and scientific knowledge to use it properly.


LEED Platinum Hotel embodies the failings of LEED

Image

On March 14, 2019 the US Green Building Council (USGBC) finally awarded the Hotel at Oberlin its LEED-platinum rating after earning 81 points under the LEED NC v2009 system, just over the 80-point minimum required for the platinum rating.  This milestone comes as a relief to Oberlin College which has for three years falsely claimed the Hotel at Oberlin to be a LEED-platinum building.  But a good day for Oberlin College is a bad day for the US Green Building Council because there is nothing exemplary about the Hotel’s energy performance — it is the very definition of mediocrity.  This latest member of the elite club of LEED-platinum hotels – I think it is the fifth such hotel in the U.S. – uses more energy per square foot than do 75% of other U.S. hotels and uses more natural gas than any other Oberlin College building except its Science Center.

The design team for the Hotel at Oberlin projected that it would annually use 1.43 million kWh of electric energy and 8,350 therms of natural gas.  These energy projections, if realized, would correspond to a site EUI of 56 kBtu/sf and a source EUI of 151 kBtu/sf.  The LEED Scorecard for the building shows that the USGBC awarded the building the maximum possible points for energy efficiency –19 out of 19 possible.

Had the Hotel achieved this projected target energy, however, it would not be an impressive accomplishment.  This target site EUI is still higher than that of 25% of the estimated 30,000 U.S. Hotels  We know about energy use by U.S. Hotels from the 2012 Commercial Building Energy Consumption Survey (CBECS).  The graph below shows the SiteEUI distribution for U.S. Hotels as determined from this survey.  It is clear that the projected site EUI use for the Hotel at Oberlin is lower than 75% of these hotels.  A similar statement can be made about the projected source EUI for the hotel.

More importantly, the Hotel at Oberlin has never achieved this projected energy use figure.  Since opening nearly three years ago the natural gas use has been 4-6 times higher than projected by its design team!  For the last 12 months the electric and natural gas use have been 1,680,000 kWh and 48,000 therms, respectively.  These correspond to annual site and source EUI of 104 and 215 kBtu/sf, respectively.  The graph below shows that this SiteEUI for the Hotel at Oberlin is higher than that of 75% or 22,500 of U.S. Hotels. The energy performance of this LEED Platinum Hotel is worse than mediocre.

The bottom line is that the Hotel at Oberlin, one of only five LEED-platinum hotels in the US, has energy use that is typical of U.S. Hotels — near the middle of the distribution.  There is nothing noteworthy or remarkable about its energy use, either site or source.  Its certification as one of the nation’s most energy-efficient hotels is simply an embarrassment to the USGBC.  It illustrates how meaningless energy efficiency points are for LEED certification.