Energy Star Scores for LEED EBOM Offices

This is my first post in over a year. As with most of us, covid-19 has changed my priorities.

For some time now I have been studying the energy performance of LEED buildings using Municipal building energy benchmarking data.  I have also investigated the science that underpins the EPA’s building Energy Star score.  In our most recent study, these two issues intersect.

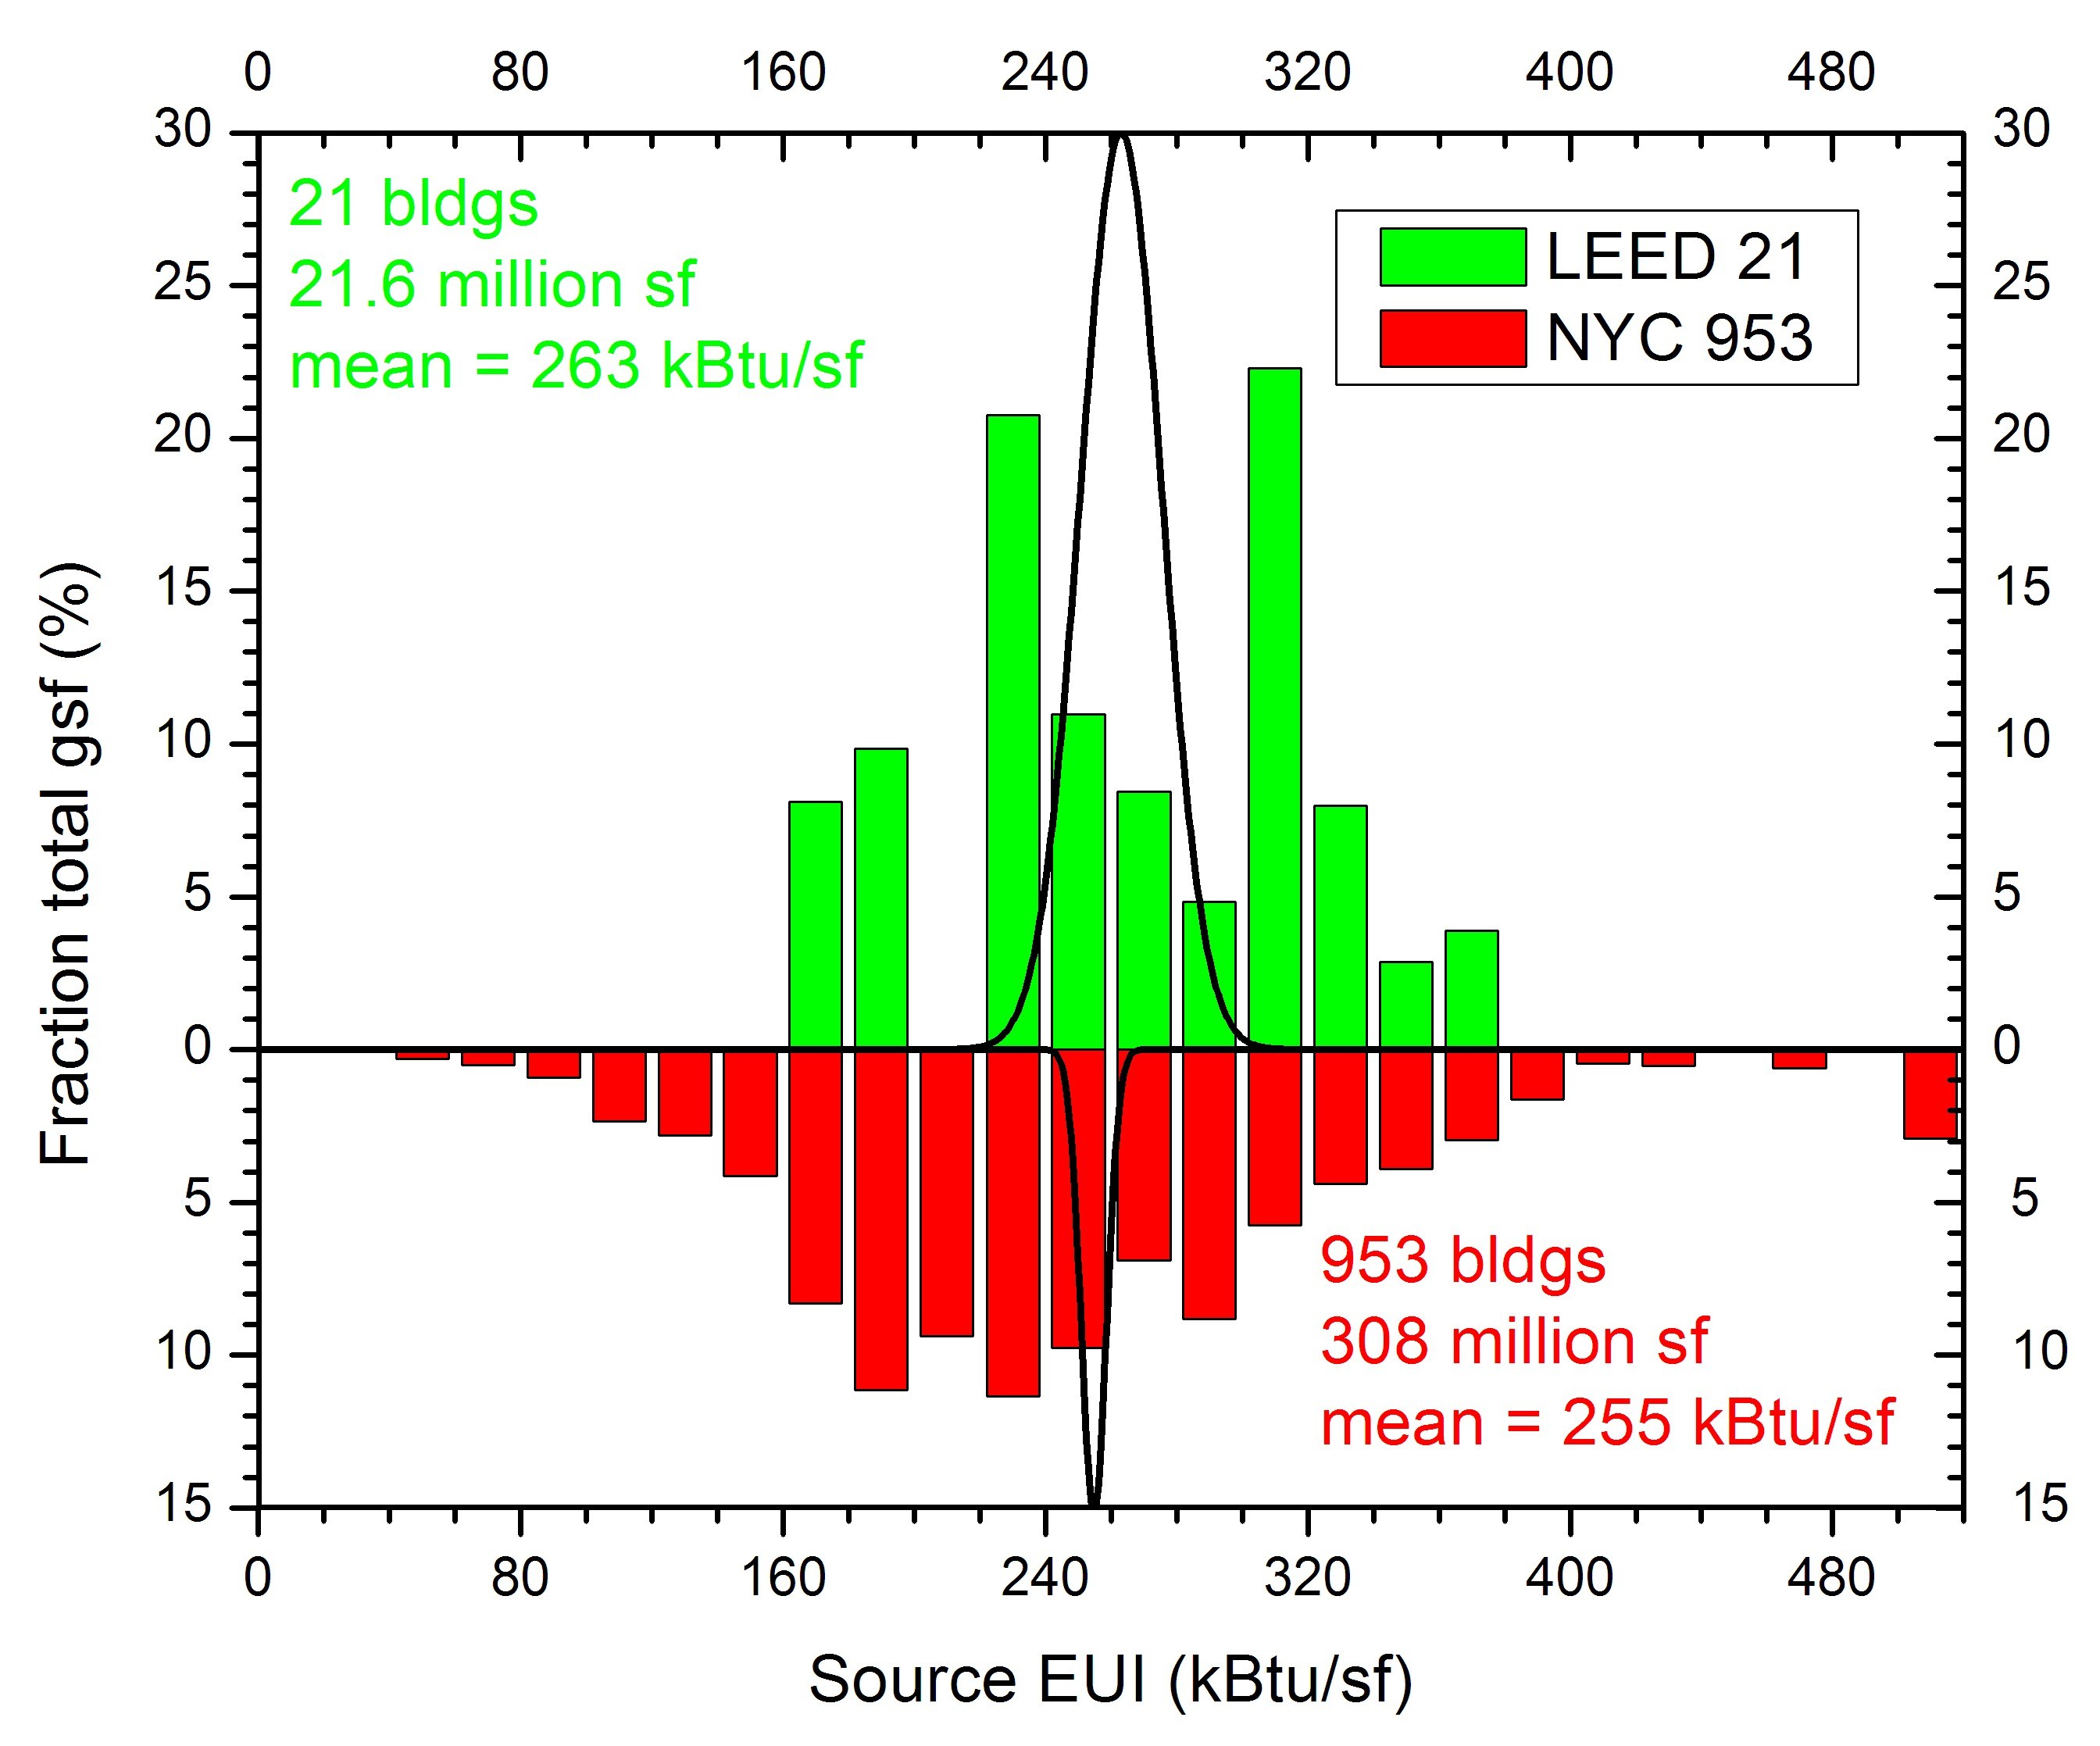
We have completed the largest study of measured energy performance of LEED-certified buildings.  The sources of our data are publicly-reported building energy data from ten cities: Boston, Chicago, Denver, Los Angeles, Minneapolis, NYC, Philadelphia, Portland, Seattle, and Washington DC.  In total we have 2016 energy data from 28,480 properties (buildings or groups of buildings) in these 10 cities.  In these data we have identified about 850 LEED-certified commercial buildings.  This has allowed us to compare the 2016 energy use of LEED buildings with those of similar buildings in the same city for the same year.

Here I want to talk about just one aspect of this study – the 2016 Energy Star scores for offices that were certified under LEED EB:OM (Existing Buildings: Operation & Maintenance).  Offices certified under a LEED EB:OM system are awarded LEED points for energy optimization based on the Energy Star score they earn during a year of operation.  This score (EAc1) can be found for many of these buildings on the Green Building Information Gateway web site.  And this score can be used to determine the Energy Star score that was reported to the USGBC used to earn this score.

Now if a building earned an Energy Star score of 85 at the time of LEED certification, you would expect it to continue earning a similar high score for subsequent years of operation.  We have compared this “Design Energy Star score” (i.e., the score that was used in awarding EAc1 points) with the Energy Star score reported in 2016 municipal benchmarking data for nearly 450 LEED certified offices in these 10 cities.  The graph below shows this comparison.  The color code indicates the LEED system used for certification.

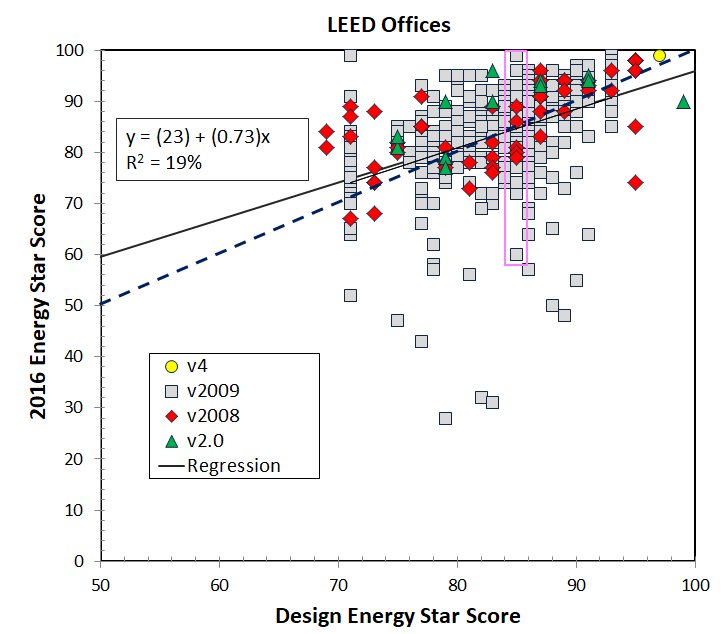
The graph shows there is surprisingly little correlation between these two Energy Star scores.  The purple dashed line represents y = x, the expected result if the 2016 Energy Star score earned by the building is the same as that submitted for certification.  The solid black line is the actual trend line obtained by fitting a straight line to the data.

What we see is that only 19% of the variation in 2016 Energy Star scores is “explained” by the score submitted at time of certification.  81% of the variations in 2016 Scores is unrelated to this initial score.  The pink rectangle shows the range of 2016 Energy Star scores for offices that earned a score of 85 at time of certification.  There are 35 such buildings, and their 2016 Energy Star scores range from 60 to 99.  You see similar variation everywhere along the curve.  In the most outrageous cases a building’s Energy Star score in 2016 was 52 points lower than what was reported when it was LEED certified!

It is very doubtful that these changes in Energy Star score reflect real changes in the energy consumption and operation of these offices.  A much more likely explanation is that the operating parameters reported in securing these scores have changed – not reflecting real changes in computer density, or worker density, or operating hours, but just arbitrary changes due to the fact that a different person (with different motivations) reported these numbers in 2016 from the person who reported them at time of certification. The data illustrate the arbitrary nature of the Energy Star score and the ability to significantly change the score by just submitting different operating parameters.  There is no regulation of these submittals – you can change the number of computers in the building from 4000 to 8000 and there is no one who will question the number.  And this will dramatically change your Energy Star score.

In the past the EPA’s Group that works on Energy Star scores has had exclusive access to the data they gather. But with cities publishing these scores we now have the ability to check them and to see their patterns. The mean and median Energy Star score for the 4200+ offices in the benchmarking data are 74 and 80, respectively.  The EPA claims that the median Energy Star score is 50.  This is nonsense.  These 4200+ offices constitute a sizable fraction of the U.S. office space.  Like the children of Garrison Keillor’s mythical Lake Wobegon, all urban buildings are above average.

ENERGY STAR energy benchmarking is not ready for prime time

I recently had occasion to read an old paper by Janda and Brodsky describing the “first class” of ENERGY STAR certified office buildings.  This is one of only a handful of papers in the peer-reviewed literature regarding ENERGY STAR building scores.  Janda and Brodsky describe the brand name ENERGY STAR as

a set of voluntary partnerships between the U.S. government and product manufacturers, local utilities, home builders, retailers, and businesses.  These partnerships are designed to encourage energy efficiency in products, appliances, homes, offices, and other buildings.

This was the basis for the EPA’s building ENERGY STAR scoring system.  It was a “game” that building managers voluntarily agreed to play with rules (methodology for scoring buildings) set by the EPA in consultation with those playing the game.  There was no scientific vetting of the “rules of the game” — nor did there need to be — it was just a game designed to “encourage energy efficiency.”  No one was forced to play the game.  Data submitted to Portfolio Manager (the EPA’s web-based tool for calculating scores) and ENERGY STAR scores issued by the EPA were confidential — unless a building sought and received ENERGY STAR certification.  Participation was entirely voluntary.  Building managers disappointed with their ENERGY STAR scores could just walk away from the game — no harm, no foul.

But this has all changed.  In recent years 1) the EPA has published specific claims regarding energy savings associated with its ENERGY STAR benchmarking program (real savings not just fantasy football), 2) external organizations like the USGBC have adopted the ENERGY STAR score as their metric for energy efficiency in green building certification programs and are using these scores to make energy savings claims of their own, and 3) major U.S. cities have passed laws requiring commercial building owners to use Portfolio Manager to benchmark their buildings and, in many cases, the resulting ENERGY STAR scores are being made public.  With federal, state, and local governments requiring LEED certification for public buildings this is no longer a voluntary game — it is mandatory and real (testable) energy claims are being made based upon ENERGY STAR scores.  Now the science behind such claims actually matters — and this science has never been vetted.

Its kinda like a small, “mom and pop” operation that has been selling chicken soup using “grandma’s recipe” without obtaining proper license or FDA approval.  Now imagine Walmart decides to market and sell the soup — the scrutiny changes.

As a voluntary game with no connection to reality it is OK that the EPA negotiates rules for its ENERGY STAR ratings with different constituents — like allowing Washington DC office buildings to ignore their “first floors” in seeking ENERGY STAR certification.  After all, who am I to interfere in the activities between consenting adults when these activities do not affect me?  But for ENERGY STAR — these days are gone.

In the next year we will learn much about the science that underpins the EPA’s ENERGY STAR benchmarking system — and the results are likely to be very disappointing.  This benchmarking system is not ready for prime time.

NYC Energy Benchmarking raises questions about LEED-certification

With growing concern over global climate change and the US Federal government frozen in political gridlock a number of U.S. cities have decided to unilaterally take action to reduce their own green house gas (GHG) emission.  Any serious effort to reduce GHG emission must involve the implementation of some kind of system to track energy consumption.  To this end these same cities have instituted Energy Benchmarking laws — laws that require building owners to annually submit energy consumption data (by fuel) to a designated agency that collects and processes these data.  The Institute for Market Transformation (IMT) has been instrumental in coordinating this effort.

The requirement is typically phased in over a couple of years — starting with municipal buildings, followed by large commercial buildings, smaller commercial buildings, and finally residential buildings.  New York City, Philadelphia, Washington DC, San Francisco, Austin, and Seattle were the first to pass such ordinances.  Minneapolis, Chicago, and Boston have all taken steps to follow suit.

Public disclosure of energy data is an important component of many (but not all) of these local ordinances.  New York City (NYC) is further along than other cities and last October released 2011 energy benchmarking data for commercial buildings that were 50,000 sf or larger — excluding condominiums.  Public benchmarking data were released for more than 4,000 large commercial buildings in the NYC’s five boroughs.  NYC, like many of the other cities engaged in benchmarking, utilized the EPA’s ENERGY STAR Portfolio Manager for gathering and processing benchmarking data.  Data released included building address, building type, total gsf, site energy intensity, weather-normalized source energy intensity, water usage, and total GHG emission.

The NYC benchmarking data included data for more than 1,000 office buildings.  Some of these buildings are certified green buildings, so would be expected to use less energy and have less GHG emission than other NYC office buildings.  These green buildings are not identified in the NYC Benchmarking data, but many may be identified by searching other data bases – such as the US Green Building Council’s LEED project database or the EPA’s list of ENERGY STAR certified buildings.

A few dozen LEED-certified office buildings have been identified in the 2011 NYC Benchmarking database.  (The full peer-reviewed paper is to be published in Energy and Buildings.)  Of these, 21 were certified before 2011 by new construction (NC), existing buildings operation and maintenance (EB:O&M), or core and shell (CS) LEED programs which address whole building energy use.  These 21 buildings constitute 21.6 million gsf.  Their 2011 source energy consumption and GHG emission has been compared with those for the other NYC office buildings with rather surprising results.  The LEED-certified office buildings, collectively are responsible for 3% more source energy consumption and GHG emission than other large NYC office buildings (adjusted for total gsf, of course).  The graph below compares source energy intensity histograms for the two building sets.

Source LEED-21 vs NYC 953pos

The graph shows that the difference in the mean source energy intensities of the two building sets is not statistically meaningful.  In other words, the source energy consumption and green house emission of these LEED-certified office buildings is no different from that of other NYC office buildings — no more and no less.

As of a few months ago there were something like 8,300 buildings certified under one of the LEED programs that claim to reduce whole building energy use.  Measured energy consumption data have been published for 3% of these (now about 250).  While many of these LEED buildings surely save energy, many do not.  Collectively the evidence suggests, that LEED certification does not produce any significant reduction in primary energy use or GHG emission.

Why then does the Federal Government — and other governments (including NYC) — require new government buildings to be LEED certified?   The Federal Drug Administration (FDA) would never certify a medical drug with so little scientific evidence offered — let alone require its use.  The standards here are inverted — apparently the Federal Government believes convincing scientific data must be offered to demonstrate that LEED-certified buildings do not save energy before they will change their policy.