Unknown's avatar

About The Pragmatic Steward

Professor of Physics at Oberlin College. I was originally trained as a condensed matter experimentalist. In the last 15 years my research has focused on photovoltaic devices, PV arrays, wind energy, energy efficiency, and energy use in buildings.

NYC Energy Benchmarking raises questions about LEED-certification

With growing concern over global climate change and the US Federal government frozen in political gridlock a number of U.S. cities have decided to unilaterally take action to reduce their own green house gas (GHG) emission.  Any serious effort to reduce GHG emission must involve the implementation of some kind of system to track energy consumption.  To this end these same cities have instituted Energy Benchmarking laws — laws that require building owners to annually submit energy consumption data (by fuel) to a designated agency that collects and processes these data.  The Institute for Market Transformation (IMT) has been instrumental in coordinating this effort.

The requirement is typically phased in over a couple of years — starting with municipal buildings, followed by large commercial buildings, smaller commercial buildings, and finally residential buildings.  New York City, Philadelphia, Washington DC, San Francisco, Austin, and Seattle were the first to pass such ordinances.  Minneapolis, Chicago, and Boston have all taken steps to follow suit.

Public disclosure of energy data is an important component of many (but not all) of these local ordinances.  New York City (NYC) is further along than other cities and last October released 2011 energy benchmarking data for commercial buildings that were 50,000 sf or larger — excluding condominiums.  Public benchmarking data were released for more than 4,000 large commercial buildings in the NYC’s five boroughs.  NYC, like many of the other cities engaged in benchmarking, utilized the EPA’s ENERGY STAR Portfolio Manager for gathering and processing benchmarking data.  Data released included building address, building type, total gsf, site energy intensity, weather-normalized source energy intensity, water usage, and total GHG emission.

The NYC benchmarking data included data for more than 1,000 office buildings.  Some of these buildings are certified green buildings, so would be expected to use less energy and have less GHG emission than other NYC office buildings.  These green buildings are not identified in the NYC Benchmarking data, but many may be identified by searching other data bases – such as the US Green Building Council’s LEED project database or the EPA’s list of ENERGY STAR certified buildings.

A few dozen LEED-certified office buildings have been identified in the 2011 NYC Benchmarking database.  (The full peer-reviewed paper is to be published in Energy and Buildings.)  Of these, 21 were certified before 2011 by new construction (NC), existing buildings operation and maintenance (EB:O&M), or core and shell (CS) LEED programs which address whole building energy use.  These 21 buildings constitute 21.6 million gsf.  Their 2011 source energy consumption and GHG emission has been compared with those for the other NYC office buildings with rather surprising results.  The LEED-certified office buildings, collectively are responsible for 3% more source energy consumption and GHG emission than other large NYC office buildings (adjusted for total gsf, of course).  The graph below compares source energy intensity histograms for the two building sets.

Source LEED-21 vs NYC 953pos

The graph shows that the difference in the mean source energy intensities of the two building sets is not statistically meaningful.  In other words, the source energy consumption and green house emission of these LEED-certified office buildings is no different from that of other NYC office buildings — no more and no less.

As of a few months ago there were something like 8,300 buildings certified under one of the LEED programs that claim to reduce whole building energy use.  Measured energy consumption data have been published for 3% of these (now about 250).  While many of these LEED buildings surely save energy, many do not.  Collectively the evidence suggests, that LEED certification does not produce any significant reduction in primary energy use or GHG emission.

Why then does the Federal Government — and other governments (including NYC) — require new government buildings to be LEED certified?   The Federal Drug Administration (FDA) would never certify a medical drug with so little scientific evidence offered — let alone require its use.  The standards here are inverted — apparently the Federal Government believes convincing scientific data must be offered to demonstrate that LEED-certified buildings do not save energy before they will change their policy.

“The Undercover Economist” writes about the Jevons’ Paradox

It is widely believed that improved energy efficiency results in saved energy.  An Englishman named William Stanley Jevons challenged this idea in the 19th century — long before Energy Star and CAFE standards.  His idea became known as “Jevons’ paradox.”  Tim Harford — aka the “Undercover Economist” — writes about this in his essay Energy efficiency gives us money to burn.  It is worth the read.

Jevons’ paradox appears to be at work in commercial buildings — particularly those that are achieving LEED certification.  NYC energy benchmarking data released last fall reveals that NYC office buildings have Energy Star scores that suggest they are more efficient than office buildings nationally.  But here is the rub — they use no less energy?  Their gross energy intensity — either site or source — is no lower than national averages, even though their average Energy Star scores is 68.  If you look at just the LEED-certified office buildings in the data the results are even more striking.  NYC LEED-certified office buildings have an average Energy Star score of 78 — yet, like other NYC office buildings, use no less energy (site or source) than national averages.

Is this evidence that supports Jevons or does it, instead, suggest problems with the Energy Star and LEED scoring systems?  Time will tell.

New Republic article on New York’s “greenest skyscaper”

Check out Sam Roudman’s article “Bank of America’s Toxic Tower” that appears in the latest issue of the New Republic.  Roudman is a free lance writer who lives in New York and writes about environmental issues.

The Bank of America Tower — the subject of Roudman’s article — is the first skyscraper to earn the USGBC’s LEED-platinum rating.  It has been hailed as “the most environmentally-responsible high-rise office building.”  Yet when NYC energy benchmarking data were released last November we learned that the Bank of America building used more than twice as much energy per square foot than does, for instance, the 80-year old Empire State Building.

Do Buildings that use Energy Star’s Portfolio Manager save energy?

The EPA regularly puts out press releases claiming the amount of energy that has been saved nationally by its Energy Star program.  In its October 2012 Data Trends publication entitled “Benchmarking and Energy Savings” the EPA writes the following:

Do buildings that consistently benchmark energy performance save energy? The answer is yes, based on the large number of buildings using the U.S. Environmental Protection Agency’s (EPA’s) ENERGY STAR Portfolio Manager to track and manage energy use.

After making this claim the EPA offers the following supporting evidence.

Over 35,000 buildings entered complete energy data in Portfolio Manager and received ENERGY STAR scores for 2008 through 2011, which represents three years of change from a 2008 baseline. These buildings realized savings every year, as measured by average weather-normalized energy use intensity and the ENERGY STAR score, which accounts for business activity. Their average annual savings is 2.4%, with a total savings of 7.0% and score increase of 6 points over the period of analysis.

What does this mean?  Does this mean that every one of the 35,000 buildings in question saw energy savings?  Impossible – over time some buildings saw their energy use go up and others saw it go down.  The statement clearly refers to an average result.  But what is being averaged?  The EPA is referring to the average (weather normalized) source energy intensity (EUI) for these 35,000 buildings — saying that it has decreased by 7% over three years  In addition it points out that the average Energy Star score for these buildings has increased by 6 points over three years.  The graphs below summarize these trends.

Data Trends

So here is the problem.  The average EUI for a set of N buildings has nothing to do with the total energy used by these buildings.  The average EUI could go down while the total energy use goes up and vise versa.  Some buildings see their EUI go up – and these buildings use more energy – and some see their EUI go down – and these buildings use less energy.  But you cannot determine whether more or less energy is used in total without calculating the actual energy saved or lost by each building – and this requires that you know more than the energy intensity (EUI) — you must also factor in each building’s size or gsf.  This set of 35,000 buildings includes buildings that are 5,000 sf in size and others that are 2,000,000 sf in size – a factor of 400 larger.  The EPA calculates mean EUI by treating every building equally.  But each building does not contribute equally to the total energy – bigger buildings use more energy.   (The EPA has employed the methodology used by the New Buildings Institute in their, now discredited, 2008 study of LEED buildings.)

It may be that these 35,000 buildings, in total, save energy.  But we don’t know and the EPA has offered no evidence to show that they do.  Moreover, I have asked the EPA to supply this evidence and they refuse to do so.  It is an easy calculation – but they choose not to share the result.  You can bet they have performed this calculation – why do you suppose they don’t share the result?

Now turn to the increased average Energy Star score.  There is actually no connection whatsoever between the average Energy Star score for a set of buildings and their total energy use.  For a single building, its Energy Star score, combined with its measured EUI and gsf allows you to calculate the energy it saved as compared with its predicted energy use.  Readers might be surprised to learn that a building’s Energy Star score can go up while its energy use rises as well.

But for a collection of buildings no such relationship exists.  If they are all one type of building (for instance, all dormitories) you can combine their individual scores with their individual gsf and their individual EUI to learn something about their total energy – but absent this additional information it is hopeless.  And if the buildings are from more than one building type there is absolutely no meaning to their average Energy Star Score.  Such statistics are intended only to impress the ignorant.

The EPA, therefore, has presented no evidence to support the claim that buildings that are regularly scored in Portfolio Manager collectively save energy.  Instead they have offered meaningless sound bites — claims that sound good but have no scientific relevance.

It is easy to see the problem by considering a simple case — two buildings – one a 100,000 sf office building and the other a 10,000 sf medical office.  Suppose in year 1 the office building has an EUI of 100 kBtu/sf and an Energy Star Score of 60, while in year 2 it has an EUI of 120 kBtu/sf and an Energy Star Score of 58.  Suppose that the medical office building in year 1 has an EUI and Energy Star score of 140 kBtu/sf and 50, respectively, and in the year 2 an EUI of 120 kBtu/sf and an Energy Star score of 60.

In this simple example the “average EUI” for year 1 is 120 kBtu/sf and for year two is 110 kBtu/sf – by the EPA’s standards, an 8% energy savings.  But when you work out the numbers you find their combined energy use in year two actually rose by 14%.  Surely EPA officials understand the difference.

To summarize, the EPA has claimed that the energy consumption of buildings that regularly use portfolio manager has gone down by 2.4% per year but they have offered no evidence to support this – only evidence that the average EUI for these 35,000 buildings – a meaningless figure, has gone down.

The EPA should either withdraw their claim or provide the evidence to back it up.

Evidence that Office Energy Star scores are inflated

This is the third in a series of posts regarding “grade inflation” for the EPA’s Energy Star building benchmarking score.  The first article looked at Medical Office buildings and the second looked at Dormitories/Residence Halls.  Here we look at evidence for inflation in scores for Office buildings.

Energy Star benchmarking was first introduced for office buildings back in 1999.  Office buildings are the largest single building type in the commercial building stock.  Since its introduction the EPA’s Office model has been revised twice, first in 2003 (based on 1999 CBECS data) then again in 2007 (based on 2003 CBECS data).  The CBECS data on which the present model is based are now 10 years out of date.  The model applies to office buildings, financial centers, banks, and courthouses – but for brevity I will simply call it the Office Model.

The current version of the Office Model used office building data from the 2003 CBECS to define its parameters — that is, model parameters were obtained from a regression applied to office building data extracted from CBECS 2003.  Therefore these data cannot be used to independently verify the distribution of Energy Star scores in the building stock.

But the 1999 CBECS data do provide an independent snapshot of the building stock that can be used to test whether or not Energy Star scores, as defined by the current Office model, are appropriately distributed.  While the building stock certainly changed somewhat from 1999 to 2003, there is no evidence that it experienced significant changes in energy consumption or efficiency.

I have extracted all office building data from the 1999 CBECS database, omitting buildings that are outside the scoring parameters of the Office model.  (For instance, the model only applies to buildings 5,000 sf or larger.  And CBECS energy consumption data are inaccurate for any of its buildings that utilize district chilled water.)  After extracting CBECS 1999 data for eligible buildings I used the 2007 Office model to calculate their Energy Star scores, then using the CBECS weights for each sampled building, produced a histogram of Energy Star scores for the entire (eligible) office/finance/bank/courthouse building stock.  The resulting histogram is shown below.

1999 Office ES histogram

This histogram represents Energy Star scores from an estimated 314,000 buildings occupying a total of 9.7 billion gsf!  The average ES for the 314,000 buildings is 62.  The graph clearly shows that the scores are not uniformly distributed and, instead, there is an overabundance of scores higher than 50.  A salute to lake Wobegon!

The above graph provides convincing evidence that 1) Energy Star scores for Office buildings do not represent their percentile ranking in the office building stock, and 2) that a score of 75 – required for Energy Star certification – does not mean that a building is using 30% less (source) energy than the average office building.

Admittedly, this is a test of the 1999 Office Building stock, not the 2013 building stock.  But it is not plausible that the commercial office building stock has gotten so much less efficient since 1999 that the histogram for 2013 buildings is uniform.  In any case, in 2014 when CBECS 2012 data are released we will have another independent survey to test this hypothesis.

To recap – this last week I have looked at the distribution of Energy Star scores for 1) medical office buildings, 2) dormitories/residence halls, and 3) offices/financial centers/banks/courthouses – and in all cases have found evidence that the mean scores for the commercial building stock is significantly higher than 50 – means were 65, 70, and 62, respectively.  This provides convincing evidence that the scoring system itself is biased to high scores – and hence the score does not represent a building’s energy efficiency percentile ranking in the population.

It would appear that the reason that the mean score for all buildings whose data are entered into Portfolio manager is 62 has a rather simple explanation — the scoring system is biased that way.  Sometimes you can’t judge a book by its cover — other times you can.

It is worth mentioning that having a uniform distribution of Energy Star scores in the building stock is a necessary, but not a sufficient condition, that the Energy Star score is legitimate.  The “bias problems” indicated above can be easily fixed – but it will represent disruptive shifts in the Energy Star score.  (How does this impact LEED and other external organizations that have adopted the Energy Star score as their metric for energy efficiency?)  After this bias is addressed – there are still legitimate questions to ask about the regression model itself.  It turns out that the definition of building energy efficiency is contained in the way the regression model is constructed – choices on regression variables impact the definition of energy efficiency.  These issues will be addressed in subsequent posts.

Energy Star scores for Dormitories are skewed

In my last posting I raised the possibility that unusually high average Energy Star scores for buildings seen this last 8 years may reflect problems with the method used by the EPA for calculating Energy Star scores.  Like the mythical children of Lake Wobegon – buildings using the Energy Star benchmarking program tend to be “above average.”

Because the Energy Star model for Medical office buildings was based on 1999 CBECS data it was possible to independently test the model predictions by utilizing 2003 CBECS data for Medical Office buildings.  What I found was that the Energy Star scores for medical office buildings were not uniformly distributed in the 2003 building population.  Instead the results were heavily biased towards higher scores, so much so that the mean score for all Medical Office buildings was 65 — well above the assumed mean of 50.  This provides convincing evidence that the Medical Office building model and the Energy Star scores it produces are not valid.  The score may still be useful for tracking the relative performance of a particular building over time.  But the score cannot have the stated meaning as a percentile ranking of a building’s energy efficiency relative to the national population.  In particular it means that quantitative energy savings cannot be inferred from the score.  An Energy Star score of 62, for instance, usually suggesting above average performance, in the case of a Medical Office building means it uses more energy than the average Medical office building.  And a score of 75 — required for Energy Star certification — does not mean that the building is 30% more efficient than the national average for such buildings.  In short, the score does not mean what the EPA has claimed that it means.

It turns out that the Energy Star model for Dormitories/Residence Halls is also based on 1999 CBECS data.  Hence the Dormitory/Residence Hall Energy Star model may also be tested by applying it to Dormitories in the 2003 CBECS survey and examining the distribution of these Energy Star scores.

The results are shown in Figure below.

Dormitory 2003 ES histogram

The histogram has the same problems that were apparent in the Medical Office histogram – namely that the scores are biased to the high end.  The mean Dormitory Energy Star score here is 70.  The graph shows that 35% of all dormitories have Energy Star scores ranging from 91-100.  For a uniform distribution only 10% of the buildings would have such scores.  The Figure also shows that 9% of all Dormitories have Energy Star scores ranging from 1-30 whereas we expect 30% of buildings to have Energy Star scores in this range.  Clearly there is a problem with this Energy Star building model.  Scores generated with this model do not have the stated interpretation (as the energy efficiency ranking), clearly are inflated, and simply are not valid.

It is now clear that two of the eleven building Energy Star models are invalid.  Moreover, the problem I have identified (inflated scoring) for these two types of buildings has been present since both scores were introduced in 2004.  It is troublesome to realize that these problems have gone undetected for nine years, particularly when it has long been known that the mean Energy Star score for all buildings whose data have been entered into Portofolio Manager is in the low 60’s.

In my future iissues I will take a look at Energy Star scores for other building types and see whether these scores stand up to external scrutiny.

Energy Star scores for Medical Office Buildings exhibit “grade inflation”

This month I am beginning a series of articles to discuss the science (or lack thereof) behind the US Environmental Protection Agency’s building Energy Star benchmarking score.  Energy benchmarking has become very popular these days with eight or more major US cities having passed ordinances requiring commercial buildings to benchmark their energy data.  The EPA’s Energy Star Portfolio Manager is being used by all these cities for this effort.  In addition, both the US Green Building Council and Green Globes have adopted the building Energy Star score as the metric for energy efficiency success in their green building certification programs.

What is Benchmarking?

Benchmarking is a process by which you compare the energy used by your building with that used by other buildings in order to learn how you stand relative to “the pack.”  The energy used by your building is easily quantified by simply recording monthly energy purchases, combining data for twelve consecutive months to determine your annual energy consumption.  Anyone interested in lowering operating costs or improving the operation of a specific building might decide to to track their own annual energy consumption, comparing annual usage for successive years.  Simply comparing annual energy use for successive years of the same building can guide a building manager in making equipment and operational changes intended to improve energy efficiency.

But it is also useful to know how your energy use compares with energy used by other, similar buildings.  This is really what benchmarking is all about.  If you learn that your building uses much more energy than most other similar buildings – that would suggest there are some changes you can make to significantly lower your own energy consumption (and cost).  If, on the other hand, your building uses much less energy than most other buildings – then it probably does not make sense to invest a lot of time and energy in making further energy efficient improvements to your building.

the Commercial Building Energy Consumption Survey

So how do you find out how much energy other buildings use?  The basic tool for this is the Commercial Building Energy Consumption Survey (CBECS) usually conducted every 3-4 years by the Energy Information Administration (EIA).  The US commercial building stock consists of about 5 million buildings with 70 billion sf of floor space.  CBECS is designed to gather data from a small fraction of these buildings (about 6,000) specifically chosen to accurately represent the entire building stock.  In addition to recording size and annual energy purchases for these buildings the survey gathers numerous other pieces of information to characterize these buildings and how they are used.  Strict confidentiality is maintained for the 6,000 or so sampled buildings.  Nevertheless, sufficient data are gathered to perform queries on the data to learn average properties for various kinds of buildings broken down by climate region, function, size, age, and use.  The last CBECS to be performed was in 2003 and data for the next survey (2012) are to be released in 2014.

The Energy Star Building Score

In 1999 the EPA first introduced its Energy Star building score for office buildings, the most common building type.  The score is a number ranging from 1-100 that is intended to represent a particular building’s percentile ranking with respect to energy consumption as compared with similar buildings nationally.  So, if your building receives a score of 75 that is supposed to mean that, if you were to look at all similar buildings across the country, your building uses less energy than 75% of them, adjusting for indicated operating conditions.  Office buildings are the most common type of building.  Presumably if it were possible to determine the Energy Star score for every office building in the country you would find that half of them have scores ranging from 1-50 and the rest from 51-100.  Similarly you expect 10% of office buildings to have scores ranging from 91-100 and another 10% would have scores from 1-10, etc.  In general, you would expect a histogram of Energy Star scores for all office buildings to look like this.

Uniform ES score distribution

The Problem with Energy Star Scores

In the last 8 years or so more and more building studies have published the Energy Star scores for fairly large sets of buildings.  For some reason the mean Energy Star scores for these buildings sets always seems to be greater than 50.  It is, of course, possible that, in each case, the buildings studied represented “better than average” buildings.  But it also raises the question – how do we know that the Energy Star scores for all US buildings are distributed as expected?  What evidence has the EPA ever offered to demonstrate the validity of these scores?  So far as I can tell the answer is none.  There are no peer-reviewed articles and no masters or Ph.D. theses describing these models and the numerous tests undertaken to demonstrate their validity.  All we have are rather short technical descriptions of algorithms used to define the models.  In fact, the EPA has known for years that the mean Energy Star score for all buildings whose data were entered into Portfolio Manager was 60 (now 62).  You would think they might want to investigate why?

One obvious way to test this is to conduct a random sample of a large number of US commercial buildings, use EPA algorithms to calculate their Energy Star scores, and see how these scores are distributed.  But the only such sample is CBECS!  When the 2012 CBECS data become available this will afford an excellent opportunity to conduct such a test – that should be sometime in 2014.  (Meanwhile, thousands of commercial buildings in major US cities are benchmarking their buildings using these Energy Star models.)  For many building types the CBECS 2003 data were the basis for the associated Energy Star model – this is the case for the current model for office buildings.  In these cases the 2003 CBECS data cannot provide independent confirmation of the Energy Star models.

But there are a few building types for which the Energy Star models are based on 1999 CBECS data.  One such building type is “Medical Office Buildings.”  In this case we can extract data for medical office buildings from CBECS 2003, calculate their Energy Star scores using the EPA’s model, then generate a histogram to show how these scores are distributed for all medical office buildings contained in the 2003 US commercial building stock.  The distribution is expected to be uniform as shown in the Figure above with some random uncertainty, or course.

I have done just that and the results are graphed below.  The graph clearly demonstrates that the scores are not uniformly distributed, and therefore the score cannot have the stated mathematical interpretation.  The mean Energy Star score is 65 well above the expected value of 50.  Nearly 45% of US medical office buildings have Energy Star scores from 81-100 – significantly higher than the expected 20%. and only 8% have scores ranging from 11-40, well below the expected 30%!  It is highly unlikely that US medical office buildings saw massive improvements in energy efficiency from 1999 to 2003.  The explanation is simpler — the model is based on faulty assumptions.

Medical Office 2003 ES histogram

This graph clearly calls into question the validity of the Energy Star Medical Office building model.  This model was developed in 2004 and has been in use for nearly a decade.  Is it possible that the EPA never conducted this simple test to check the validity of this model?   It would appear that for a decade now the EPA has employed a flawed building model to generate Energy Star scores for medical offices and to draw conclusions about the amount of energy the Energy Star program has saved.

If this one model is wrong — and the error went undetected so long — what confidence can we have in Energy Star models for other building types?

In my next issue I will look at the distribution of Energy Star scores for Dormitories/Residence Halls.

Attention College students: Environmental choices are not black and white

My institution, Oberlin College, has been burning coal to heat its buildings for probably over 100 years.  The practice continues today.  The College is concerned about the pollution associated with this and has developed a plan to phase out coal and phase in natural gas.  But Oberlin College Environmental Studies students want more — they oppose this plan and insist on a much more aggressive plan to reduce carbon.  They push plans that call for heating all buildings with ground-source heat pumps, powered by green electricity.  They naively believe that using electricity produced by landfill gas will provide our green future!  (Hello!  Utilizing someone’s waste stream is a smart opportunity but it does not scale to the nation unless we grow the waste stream.)  The problem, of course, is that greening the grid will take decades (at best).  Replacing coal with natural gas will significantly reduce carbon emission NOW, buying time for more aggressive changes in the future.

Brett Stephens addresses this very thinking today in his opinion piece in the Wall Street Journal where he discusses the Keystone Pipeline in the context of the recent runaway train explosion in a small Quebec town just north of the Maine border.  He is bang on when he asks the question, “Can Environmentalists Think?”

This is exactly what pragmatic stewardship is all about.

No evidence LEED building certification is saving primary energy

This essay is reproduced from the July 2013 issue of APS News.

Buildings are responsible for 39% of our nation’s energy consumption and associated green house gas (GHG) emission and they use 72% of the nation’s electricity [1].  It has long been established that cost-effective improvements in energy efficiency has great potential to reduce primary energy consumption and GHG emission associated with buildings.   The American Physical Society first took up this topic in 1974 [2].  A more recent APS study confirmed the potential remains [1].  Despite forty years of building technology research and public policy efforts to promote energy efficiency the energy efficiency potential for buildings remains largely untapped.

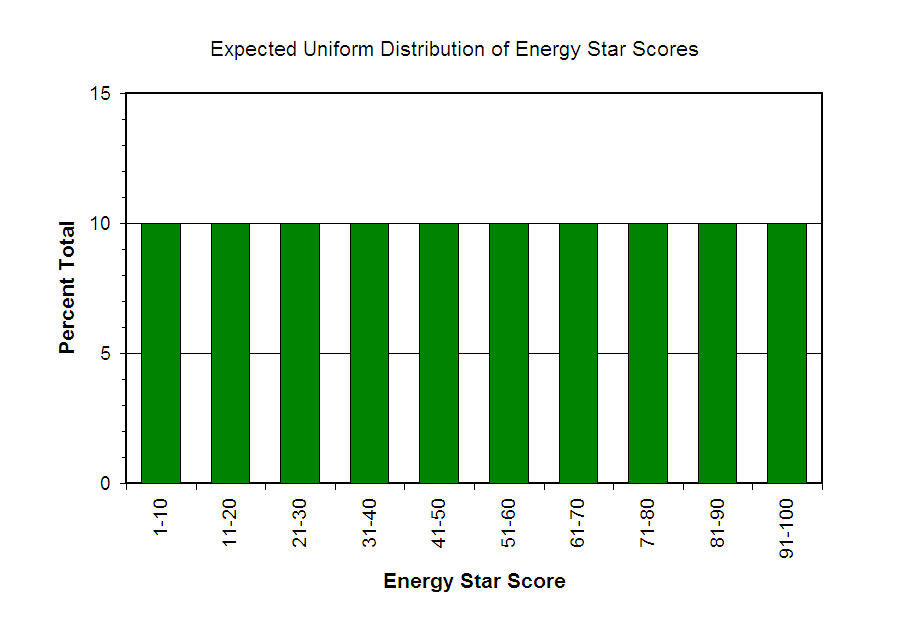
The Environmental Protection Agency (EPA) began promoting building energy efficiency in 1993 as part of its ENERGY STAR (ES) program, introducing its ES building score in 1999 [www.energystar.gov].  This score is based on measured energy consumption and is supposed to represent a building’s energy efficiency percentile ranking with respect to similar buildings in the U.S. commercial building stock.  A score of 75, required for ES Certification, implies that the building uses less primary energy than 75% of similar buildings under similar operating conditions nationally.

In 2000 the US Green Building Council (USGBC) introduced its Leadership in Energy and Environmental Design (LEED) green building rating system [www.usgbc.org].  Unlike ES, LEED certification was not based on measured energy performance but rather on “points achieved” through a checklist of items included in the building design and/or design process – all intended to make the building “green” or more energy efficient.  Four levels of certification are awarded depending on the total number of LEED points achieved – Certified, Silver, Gold, and Platinum.

LEED’s contribution was to marry the substance of energy efficiency with the popular appeal of green design.  It was a brilliant marketing strategy and, since its introduction, LEED certification has far surpassed ES certification in popularity.  Today nearly every large organization owns one or more LEED-certified buildings and many institutions – particularly governmental – have mandated that all their future buildings must be LEED certified at the silver level or higher.

But do LEED-certified buildings actually save primary energy and reduce GHG emission? LEED certification has clearly captured the public’s fancy – not unlike organic farming or herbal medicines.  But also like these fields there is a woeful lack of scientific data supporting LEED’s efficacy.  And what little measured building energy consumption data there are have been gathered through a “self-selected” process that is clearly biased towards the “better-performing” buildings.  In these data proponents find evidence that LEED-certification is saving energy [3].  But careful analysis of even these biased data show that LEED-certified buildings, with regard to primary (or source) energy consumption and GHG emission, perform like other buildings – no better and no worse [4].

First consider the amount and quality of energy consumption data published for LEED-certified buildings.  The vast majority of energy savings claims are not based on measured building energy performance but rather on design team projections.  LEED points for energy savings are based on these design projections – providing incentive for the design team to produce optimistic energy projections and to construct an inefficient “baseline” model to which these are compared.  Studies show there to be little correlation between design energy projections and subsequent measured energy performance [3, 4].  These design projections demonstrate intent not accomplishment.

There are, however, a dozen or so published studies containing measured energy consumption data for LEED-certified buildings.  These collectively provide energy data for, at most, 229 buildings – roughly 3% of the 8,309 LEED buildings certified before 2012.  Only four of these studies appear in peer-reviewed venues (two of these written by me) – the rest are reports written by or paid for by the USGBC or organizations closely aligned with it.  Buildings included in these studies are unlikely to be representative of the larger population.  Building owners control access to their energy data.  Nature – galaxies, rocks, atoms – doesn’t care what humans learn from their experiments.  Buildings do – or rather, their owners and design teams do – they have a vested interest in controlling energy data for the building for which they have already enjoyed extensive green publicity.  Owners are unlikely to voluntarily disclose embarrassing energy consumption data.  In a many cases requisite meters are not even installed – rendering the question moot.

The largest and most-widely publicized of these studies, conducted by the New Buildings Institute (NBI) in 2008 for the USGBC, concluded that “… average LEED energy use [is] 25-30% better than the national average” [3].  But the APS Energy Efficiency Study Committee concluded that the LEED buildings in the NBI study used more energy per square foot than the average for all existing commercial buildings [1].  NBI’s conclusion – similar to those published by other studies, is obtained by 1) a mathematical error in calculating the gross energy intensity for the LEED buildings, and 2) focusing on site energy – energy used at the buildings while ignoring off-site energy losses associated with electric generation and distribution.

First consider the mathematical error.  A building’s energy use intensity (EUI) is the ratio of its annual energy use to its gross square footage (gsf) or total floor area (surrogate for building volume).  EUI is convenient for comparing the energy use of two similar buildings differing only in size.  The Energy Information Agency (EIA) similarly defines the gross energy intensity of a set of N buildings to be their total energy divided by their total gsf – mathematically equivalent to the gsf-weighted mean EUI of the N buildings.  The EIA’s Commercial Building Energy Consumption Survey uses this metric to characterize the energy use of subsets of the national commercial building stock [5].  In the NBI study – indeed, in most LEED building studies – energy used by LEED sets of buildings are characterized by summing their individual EUI and dividing N.  This unweighted or “building-weighted” EUI is unrelated to the total energy used by the buildings.  When this error is corrected we find the LEED buildings in the NBI study use 10-15% less energy on site as compared with other buildings [4].

But energy used on site – called site energy – is only part of the story.  Site energy fails to account for the off-site losses incurred in producing the energy and delivering it to the building – particularly important for electric energy that, on average, is generated and distributed with 31% efficiency [1].  The EPA defines source energy to account for both on- and off-site energy consumption associated with a building; building ES scores are based on source energy consumption.  When you compare the source energy consumed by the LEED buildings in the NBI data set with that of comparable non-LEED buildings you find no difference – within the margin of error [4].

How do we understand these results?  First, LEED-certified buildings, similar to other new or renovated buildings are showing a modest reduction in energy used on site.  But these buildings are relying more on electric energy – and the off-site losses in the electric power sector are offsetting any savings in site energy.

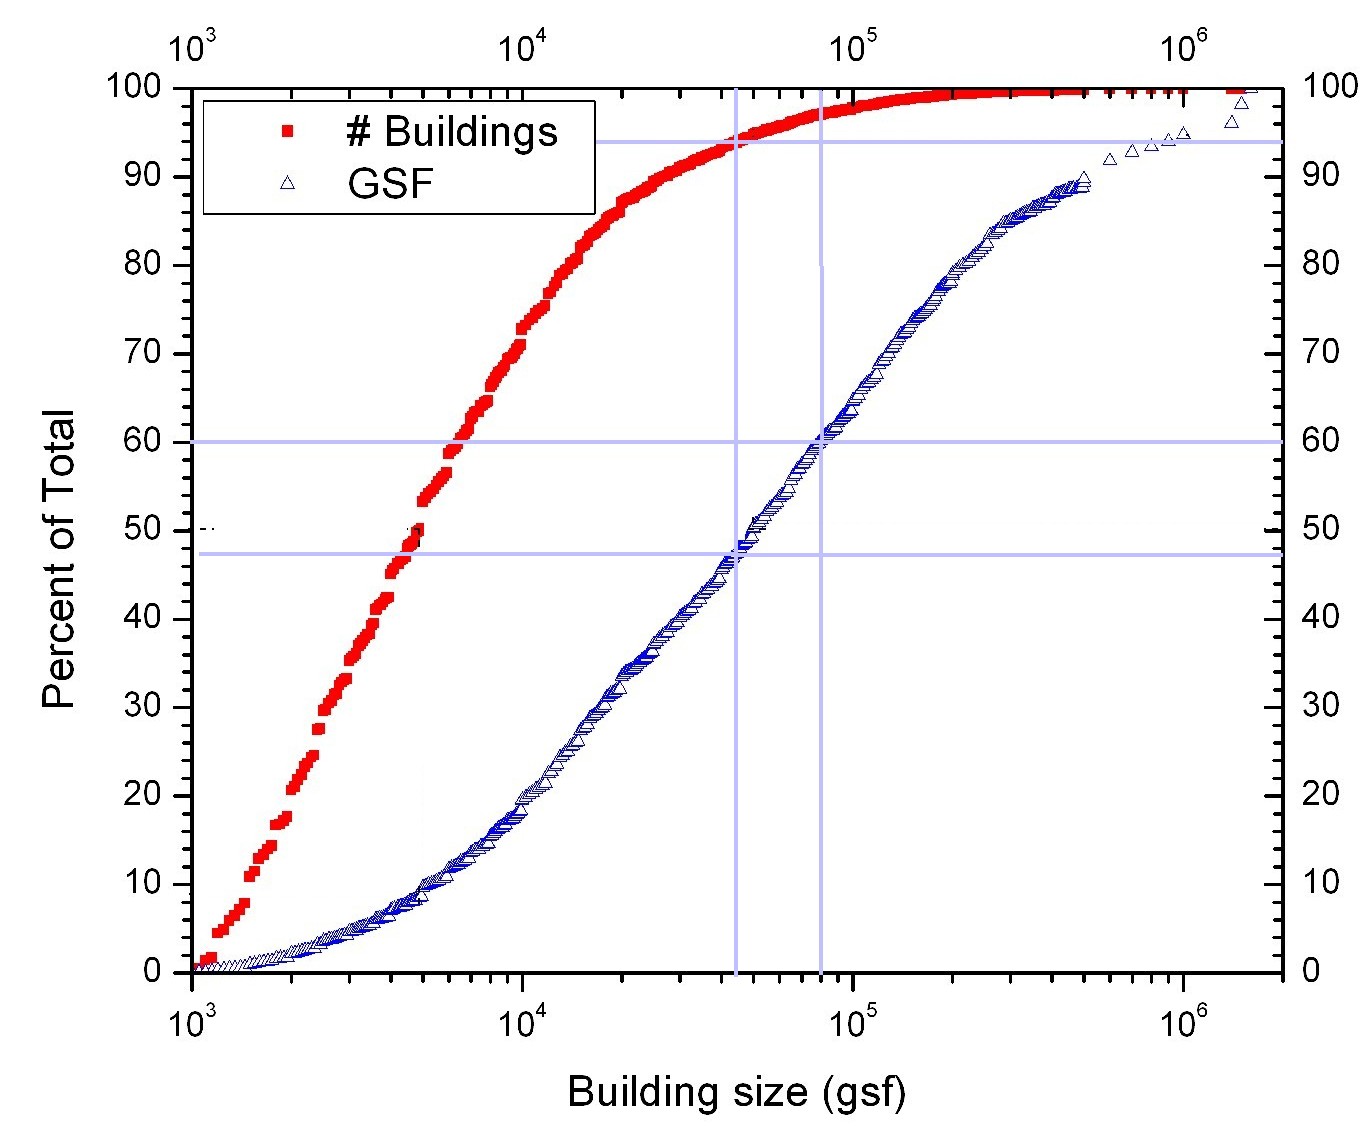
The other issue is that larger buildings tend to have higher EUI than smaller buildings.  This may seem counter-intuitive since energy use in simple buildings (like houses) is dominated by surface losses/gains (windows, insulation, etc.).  But energy use in large commercial buildings is driven by internal loads – equipment, people, and lighting.  Large office buildings are typically air-conditioned year-round.  This is seen nationally as well as in LEED-certified buildings.  Roughly 5% of the nation’s commercial buildings account for half of the gsf of the building stock – and an even larger fraction of primary energy consumption [5].

In recognition of the need for actual performance data the USGBC has required all buildings certified under its 2009 version of LEED to measure and report annual energy consumption data to the USGBC for five years following certification.  And, for its Existing Buildings program – which targets renovated buildings – the USGBC has adopted the ES building rating system as its method for determining energy efficiency points – for the first time rewarding measured energy performance.

But these changes have not yielded convincing scientific data that demonstrate energy savings for LEED.  More than 2,400 buildings have been certified under LEED 2009 – with 711 of these certified before 2012.  Yet the USGBC has released no scientific report analyzing the energy data they have collected.  Instead they “cherry-pick” the data to create clever marketing sound bites that have no scientific value.  A USGBC press release last November claimed their data reveals that 195 LEED certified buildings received ES scores averaging 89 – demonstrating a 43% energy savings [6].  So what – presumably a million (of the 5 million) buildings in the commercial building stock have an “average” ES score of 89.  Scientists should not be impressed.  Moreover, while the source energy savings of a single building may be inferred from its ES score it is mathematically impossible to determine the energy savings for a collection of buildings from their average ES score (unless they all are identical in size and function) – hence the claim of 43% energy savings is unjustified.

These days the USGBC points to the high ES scores of its Existing Buildings program as evidence of energy savings for this program.  But the “value added” by LEED-certification is not established by comparing the certified building’s ES score to 50 – the presumed mean for all US buildings – it is found by comparing its ES score to those of similar, newly-renovated buildings that did not use the LEED process.  Any newly-renovated commercial building (LEED certified or otherwise) ought to see reduced energy consumption owing to cost-effective efficiency upgrades in lighting and heating, ventilation, and air-conditioning equipment.  Moreover, many of the buildings certified under the LEED Existing Buildings program have previously been certified by ES with scores significantly higher than 50.

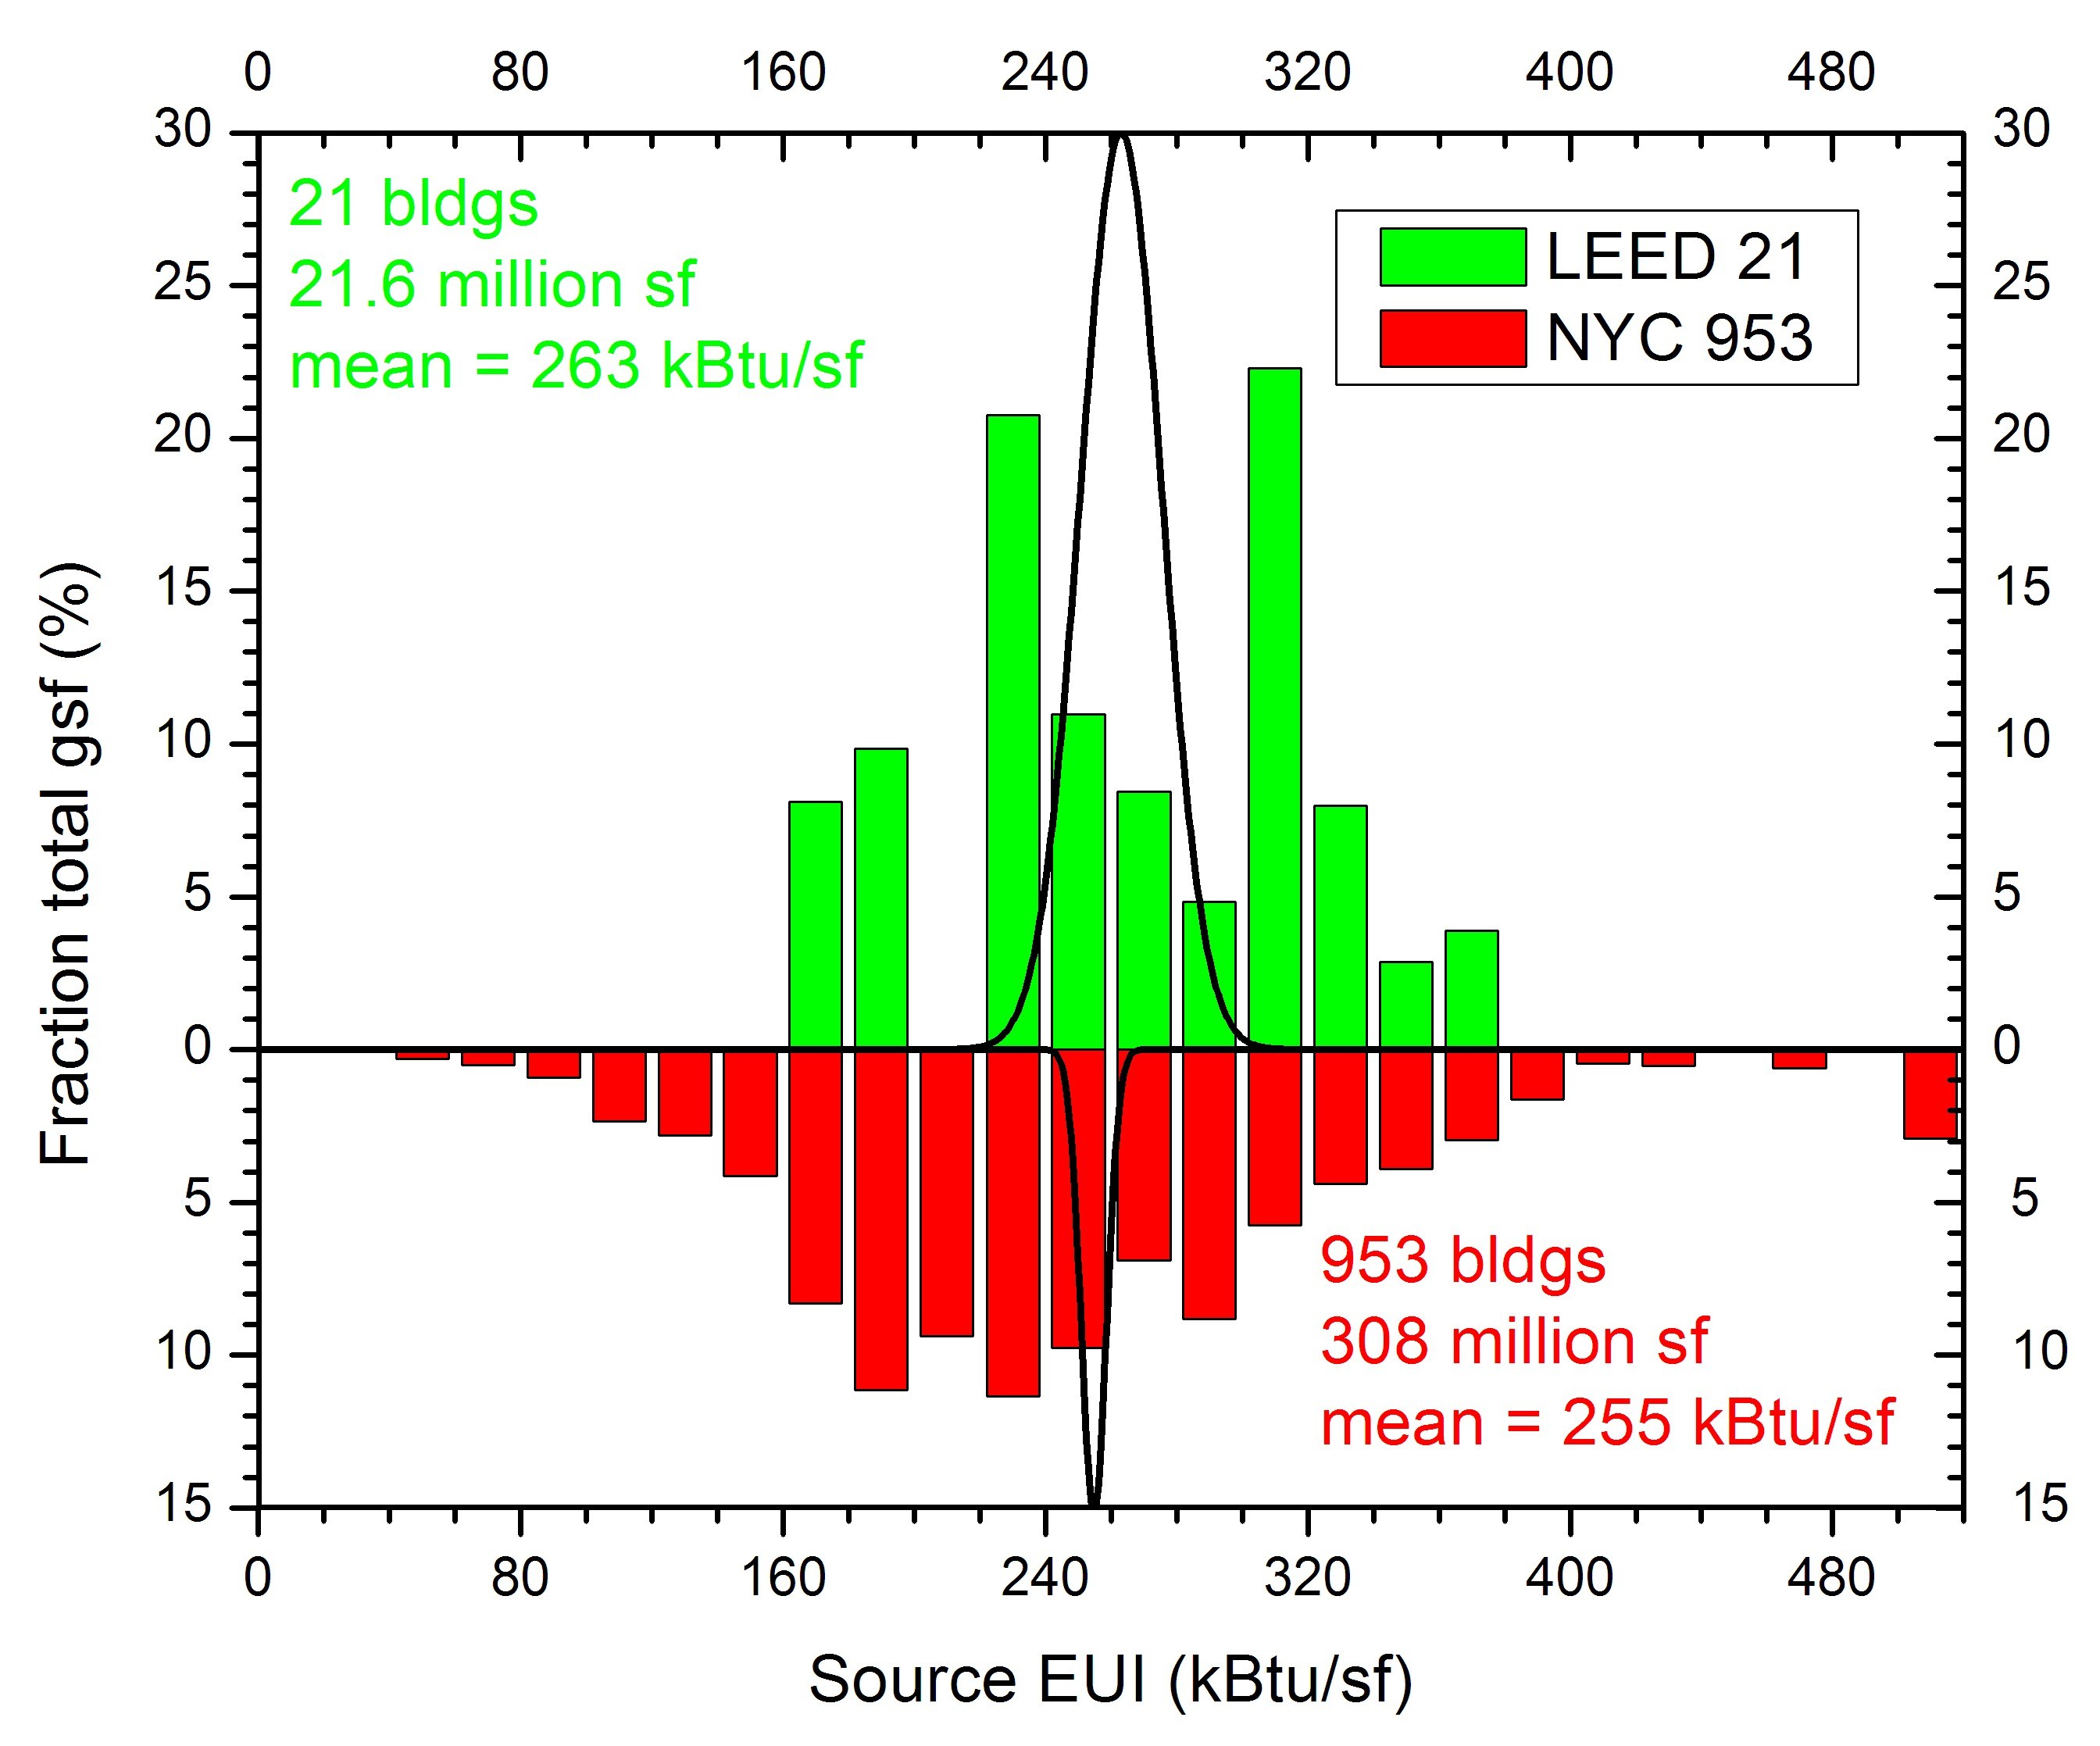
The lack of energy consumption data for LEED and other commercial buildings is soon to change.  Six of our nation’s largest cities have passed ordinances requiring all commercial buildings to annually submit their energy consumption data into the ES system for subsequent municipal use.  New York City is the first such city, and last fall it made public 2011 energy consumption data for some 4,000 buildings of 50,000 sf or larger – and this list included nearly 1,000 office buildings of which 21 were identified as LEED certified.  These data clearly show there to be no statistically significant difference between the source energy consumed by or GHG emitted by LEED certified buildings as compared with other large NYC office buildings.  It should be noted that LEED office buildings certified at the Gold level and higher did outperform other office buildings.

At present there simply is no justification for governments mandating LEED building certification – using public dollars to subsidize a private enterprise with no scientific data to demonstrate efficacy in lowering primary energy consumption or GHG emission.  The problem is that LEED does not require public disclosure of energy consumption data and it does not have a mandatory energy performance requirement.  LEED certification clearly delivers green publicity but there is no evidence for primary energy savings, except possibly at the highest levels of certification (Gold and Platinum).  The USGBC could implement changes that would result in substantive savings – but this might negatively affect “sales of their product.”  We need to stop awarding buildings green publicity at the front end of a project and, instead, save the accolades for demonstrated reduction in GHG emission and primary energy use.

References

1.   Burton Richter et al. , “How America can look within to achieve energy security and reduce global warming,” Reviews of Modern Physics, Vol. 80, no. 4, S1 (Dec. 2008).

2.   Walter Carnahan et al., “Efficient Use of Energy,” American Physical Society, 1974.

3.   C. Turner and M. Frankel, 2008, “Energy Performance of LEED for New Construction Buildings – Final Report,” New Buildings Institute, White Salmon, WA.

4.   John H. Scofield, “Re-evaluation of the NBI LEED Energy Consumption Study,” Proceedings of the International Energy Program Evaluation Conference (IEPEC), Portland, OR, Aug. 12-15, 2009, pp. 765-777.

5.   See http://www.eia.gov/consumption/commercial/

6.   http://www.usgbc.org/articles/new-analysis-leed-buildings-are-top-11th-percentile-energy-performance-nation

EPA announces the 40% of Commercial space has been benchmarked

ENERGY STAR recently issued a press release stating that “Nearly 40 percent of the nation’s building space is benchmarked in Portfolio Manager, driving billions of dollars of energy savings while helping reduce greenhouse gases in the fight against climate change.”   Follow up questions to the EPA yielded additional information that Portfolio Manager has data representing about 300,000 unique commercial buildings containing 30 billion gsf of space.

Now according to the latest Commercial Building Energy Consumption Survey (CBECS) conducted in 2003 the nation has about 4.6 million buildings containing 70 billion gsf of space.  Ignoring any increase in the nation’s building stock since 2003, that would mean that the 40% of the nation’s gsf contained in Portfolio Manager belongs to only 5% of its buildings.

Below is a graph showing the distribution of U.S. Commercial building numbers (red) and gsf (blue) versus building size (in sf) as determined from 2003 CBECS data.  The graph shows that approximately half the total gsf is contained in just the largest 5% of buildings (> 50,000 sf).  You can also see that 40% of the gsf is contained in the largest 4% of the  buildings.  Portfolio Manager has data from 6% of the nation’s buildings.  If these are the largest U.S. buildings (> 44,000 sf) then this would represent about 52% of the gsf of the U.S. commercial building stock.  Instead, Portfolio Manager contains only 40% of the total U.S. gross square footage.  This means that Portfolio Manager must have data for about 80% of the nation’s buildings that are 45,000 sf or larger and only a tiny fraction of the buildings that are smaller.CBECS 2003 building distribution - ES2

Conclusion — Portfolio Manager and ENERGY STAR benchmarking is dominated by the nation’s largest buildings.

This raises concerns on several levels.  It turns out that the model that EPA uses for calculating Energy Star scores involves political decisions — what energy to allow for.  In moving from its 2003 to its 2007 Office model these decisions specifically enhanced the score for large office buildings — making it more attractive for large buildings to adopt Energy Star.

Secondly, the average ENERGY STAR score for all buildings that have submitted data to Portfolio Manager is said to be 62.  The supposed meaning of the ENERGY STAR score is a building’s percentile ranking as compared with similar buildings.  If this is the case then the mean ENERGY STAR score for all large buildings should be 50.  But if 80% of large buildings are in Portfolio Manager — how can their mean score be 62?  This might have seemed plausible if only a small fraction of large buildings were scored — but with such a large fraction is suggests a kind of “grade inflation.”  Apparently the ENERGY STAR score does not mean what we are told it means.