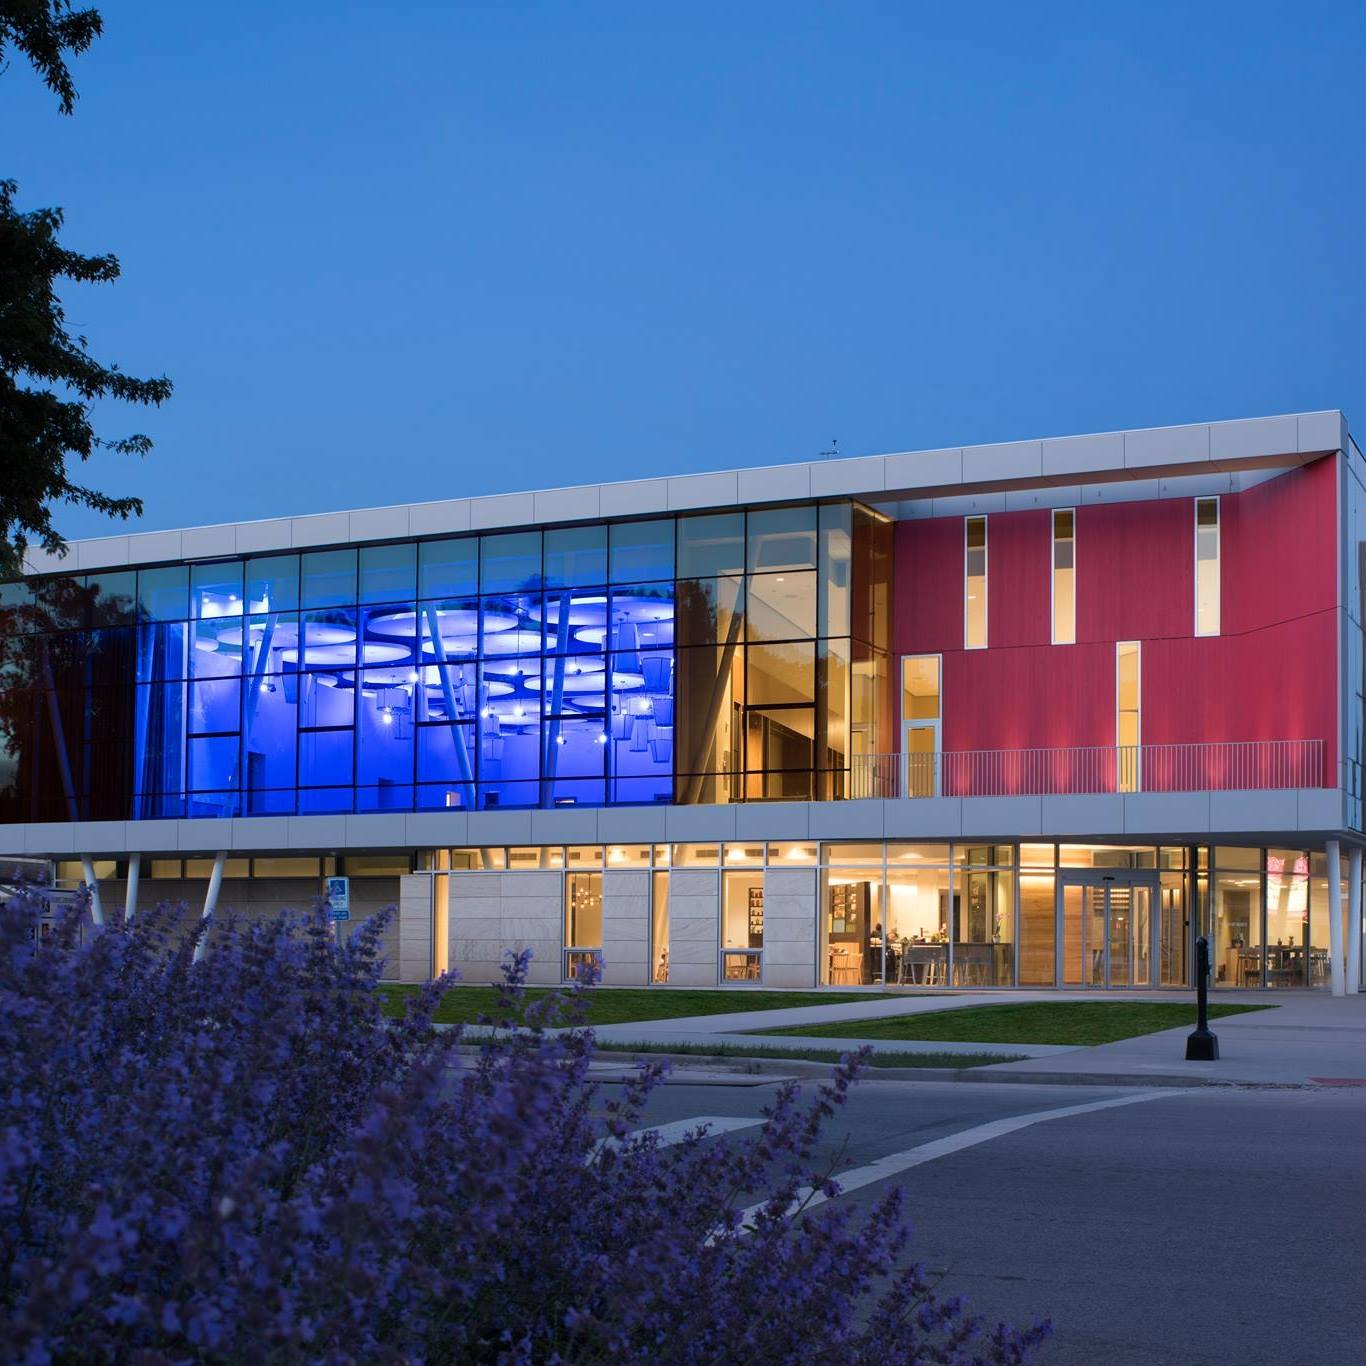
 In May 2016 Oberlin College opened its newly constructed Hotel at Oberlin. The New York Times ranked the Hotel third in its list of 5 Hotels and 5 Tours for the Eco-conciousTraveler. It is all part of the ongoing marketing effort to paint Oberlin College as a sustainable and green institution. Hard to believe that any amount of eco-spin can convince people that a view of Oberlin’s Tappan Square is environmentally rewarding.
Of course what makes the Hotel at Oberlin a green destination is not it surroundings — it is the building itself. Like the Taj Mahal, committed environmentalists will simply swoon in the presence of this green wonder. The second (and larger) of Oberlin College’s highly-publicized green buildings, the College has claimed that the Hotel is the first 100% solar powered hotel in the world and one of only five Hotels in the world to win the coveted LEED Platinum rating. In addition to claims of solar power the building is said to be heated by a geothermal well field and to include other green technologies — including radiant-cooled rooms. Its web site boldly claims that it has achieved the LEED platinum rating.
Truth is the hotel is not powered by the sun nor is it LEED-certified at any level.
I wrote about this Hotel nearly two years ago when it opened. The main focus of that post was to address the solar claim. I will not rehash the evidence here — please read the blog. The claim is a brazen and clever lie — Donald Trump would admire its creativity! Simply stated, the Hotel is no more solar powered than is my century-old home. There is not one solar panel on the building site. The 2.2 MW OSSO array that is claimed to power the Hotel was built years before the hotel, is located a mile away, and, by contract, sends all of its electricity to the City of Oberlin until 2037 at a price of $85/MWh.
Today I write to share the Hotel’s energy-performance data and to discuss its LEED rating. The Hotel is well into its second year of operation and we now have 21 months of utility data.
In my 2016 post I suggested that the Hotel would use two million kWh annually, more than double the 800,000 kWh used by the Oberlin Inn it replaced. For 2017 the Hotel actually used 1,400,000 kWh of electric energy. This is 75% more electric energy than was used by the former Oberlin Inn, but less than my estimate. It is consistent with the annual electric use projected for the Hotel by its design team.
But the Hotel also uses natural gas. The marketing literature for the Hotel says that the building is heated with ground-source heat pumps. Natural gas, we are told, is primarily for heating domestic water (laundry, showers, etc.) — available, but not anticipated for backup heat. The design team projected the annual gas use to be 8,350 therms (Ccf).
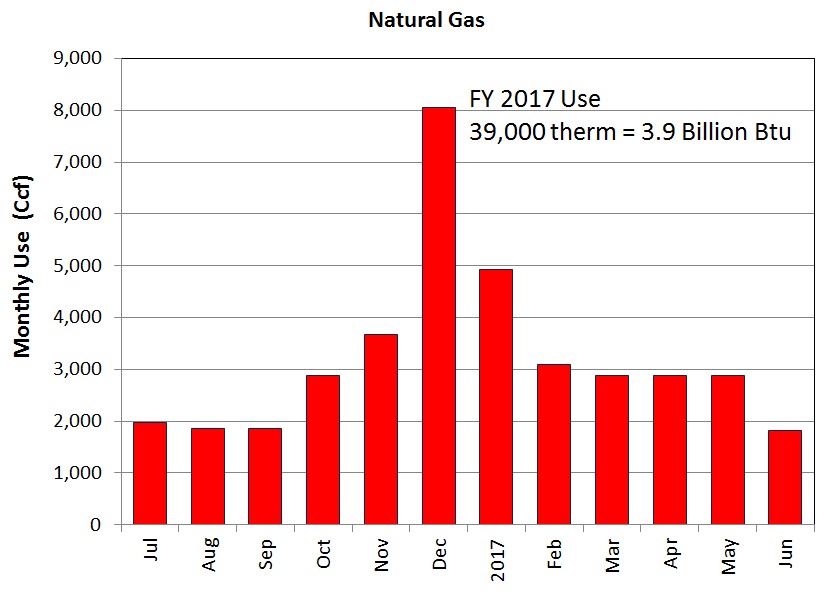
In fact, for 2017 the Hotel at Oberlin used 39,000 therms (Ccf), nearly 5X that predicted by the design team. This is more natural gas than is used by any other Oberlin College building save one — the 130,000 sf Science Center! The Science Center, constructed 17 years ago, contains numerous research and teaching laboratories and chemical hoods and has never been described as a green building. It used 58,000 therm of natural gas in FY2017. The natural gas use of the Hotel at Oberlin exceeds that of any other College building including the Firelands Dormitory (26,000 therm), the new Austin E. Knowlton complex (26,000 therms) and Stevenson Dining Hall (23,000 therms).
How does the Hotel at Oberlin’s energy performance compare with that of other hotels? Consider its Energy Star score. This can be estimated using the EPA’s Target Finder web site that allows quick data entry to estimate scores. Entering the Hotel’s floor area (103,000 sf), number of guest rooms (70), cooking facility (Yes), 100% of the space heated and cooled, and actual FY2017 energy use, and accepting other default parameters, the Hotel at Oberlin is awarded an Energy Star score of 56. According to the EPA — just a bit above average. Don’t get me wrong — I am a huge critic of the Energy Star benchmarking score. But it is one way to compare energy use with other hotels.
The monthly gas usage for the Hotel at Oberlin is shown below. The excessive use in months Nov. – Feb. is clear evidence that significant gas is used for heating. But even if you eliminate this heating use, the remaining use is nearly 3X the design estimate.
Finally, let me address the claim that the Hotel at Oberlin is certified LEED Platinum. It simply is a lie. I downloaded the USGBC LEED project database today. The Hotel at Oberlin was registered on March 8, 2013 as “Confidential.” Its LEED project ID is 1000031165. As of today, February 23, 2017 the Hotel at Oberlin is not LEED-certified at any level. The LEED project database says it has achieved 53 points — not enough to even achieve certification at even the Gold level.
Perhaps one day the claims being made for the Hotel at Oberlin will become true. There is a lesson to be learned by looking at Oberlin’s Green building, generation-I, the Adam Joseph Lewis Center.
Oberlin College’s Adam Joseph Lewis Center opened in 2000 to much acclaim. Its proponents claimed it was a zero energy building (ZEB) for more than a decade when it just wasn’t true. The claims were repeated by two Oberlin College presidents, College literature, and the College web site. The College never issued a retraction — it spent hundreds of thousands of dollars to correct flaws in the building’s HVAC design hoping to lower building energy use to a level that could be met by its 45 kW rooftop PV array. The College eventually switched from “sticks” to “carrots” and in 2006, with the gift of a million dollars, built a second, 100 kW PV array over the adjacent parking lot and, with tripled electric production, renewed its ZEB claim for the building. The building continued to use more energy than all of its arrays generated through 2011. Even when faced with incontrovertible evidence that the claim was false the College continued to print the claim for another year in admissions literature distributed to students. The College has never issued a public retraction or correction. In 2012, after hiring a full-time building manager, the building finally used less energy that year than its PV arrays generated. These arrays now feed two buildings, the AJLC and its adjacent annex. Energy-intensive functions have been located in the annex and, collectively, these two buildings use more energy than the arrays produce.
Maybe in the next decade the College will build a parking garage next to the Hotel at Oberlin and put a huge PV array on it. This could make the Hotel at Oberlin solar-powered — but not 100%. Not sure how it will solve its natural gas problem — but clever minds will think of something.
The era of Donald Trump is here. It is not illegal to lie, and no lie is too big to sell.
The bottom line is this. The Hotel at Oberlin is just a normal, expensive hotel that purchases both electricity and natural gas from the local utility companies. It uses more energy than the hotel it replaced. It is the perfect symbol of modern green wash — 20 % substance, 60% exaggeration, 20% lies.